Reown Analytics Explained
Shipping a Web3 app is one challenge. Understanding whether it's actually working — and for whom — is another. Most teams default to a patchwork of tools: onchain explorers for transaction data, third-party analytics for user behaviour, and manual queries for wallet distribution. None of it talks to each other, and none of it gives you the full picture.
Reown Analytics is built into the Reown Dashboard and gives you a single, chain-agnostic view of how users are finding, connecting to, and transacting within your app. No custom instrumentation required. If you're already using the Reown SDK, your analytics are already being collected — you just need to know where to look and what each metric means.
This guide walks you through accessing your analytics, understanding every metric section, and using that data to make informed product decisions.
Time to complete: ~10 minutes.
Prerequisites
Create a project and integrate the Reown SDK
Analytics data is tied to your Project ID. If you haven't set up a project yet:
- Go to dashboard.reown.com and sign in (or create an account).
- Navigate to your team's workspace and click + Project.
- Once the project is created, you'll find your Project ID at the top of the dashboard— copy this and configure it in your app when integrating the Reown SDK.
Once real users are interacting with your app, data will begin populating in the Analytics tab. If your app is new, give it some traffic before expecting meaningful charts.
Accessing Reown Analytics
To open Analytics in the Reown Dashboard:
- Log in at dashboard.reown.com.
- Select your project.
- Click the Analytics tab.
- Choose the section you want to explore: User Activity, Swaps, Onramp, or Users.
Full documentation for Reown Analytics is available at docs.reown.com/cloud/analytics.
Understanding Reown Analytics Charts
User Activity
The User Activity section covers the core engagement metrics for your app: who is visiting, how they're connecting, what chains they're using, and how they're authenticating.
Active Users
This metric shows the number of unique users who were active in your app during a selected time period. It's the clearest high-level signal for overall growth, retention, and engagement.
Track changes in active users to measure the impact of product launches, marketing campaigns, or incentive programs. A spike that doesn't sustain often points to a campaign effect without retention; a gradual upward trend suggests organic product-market fit.

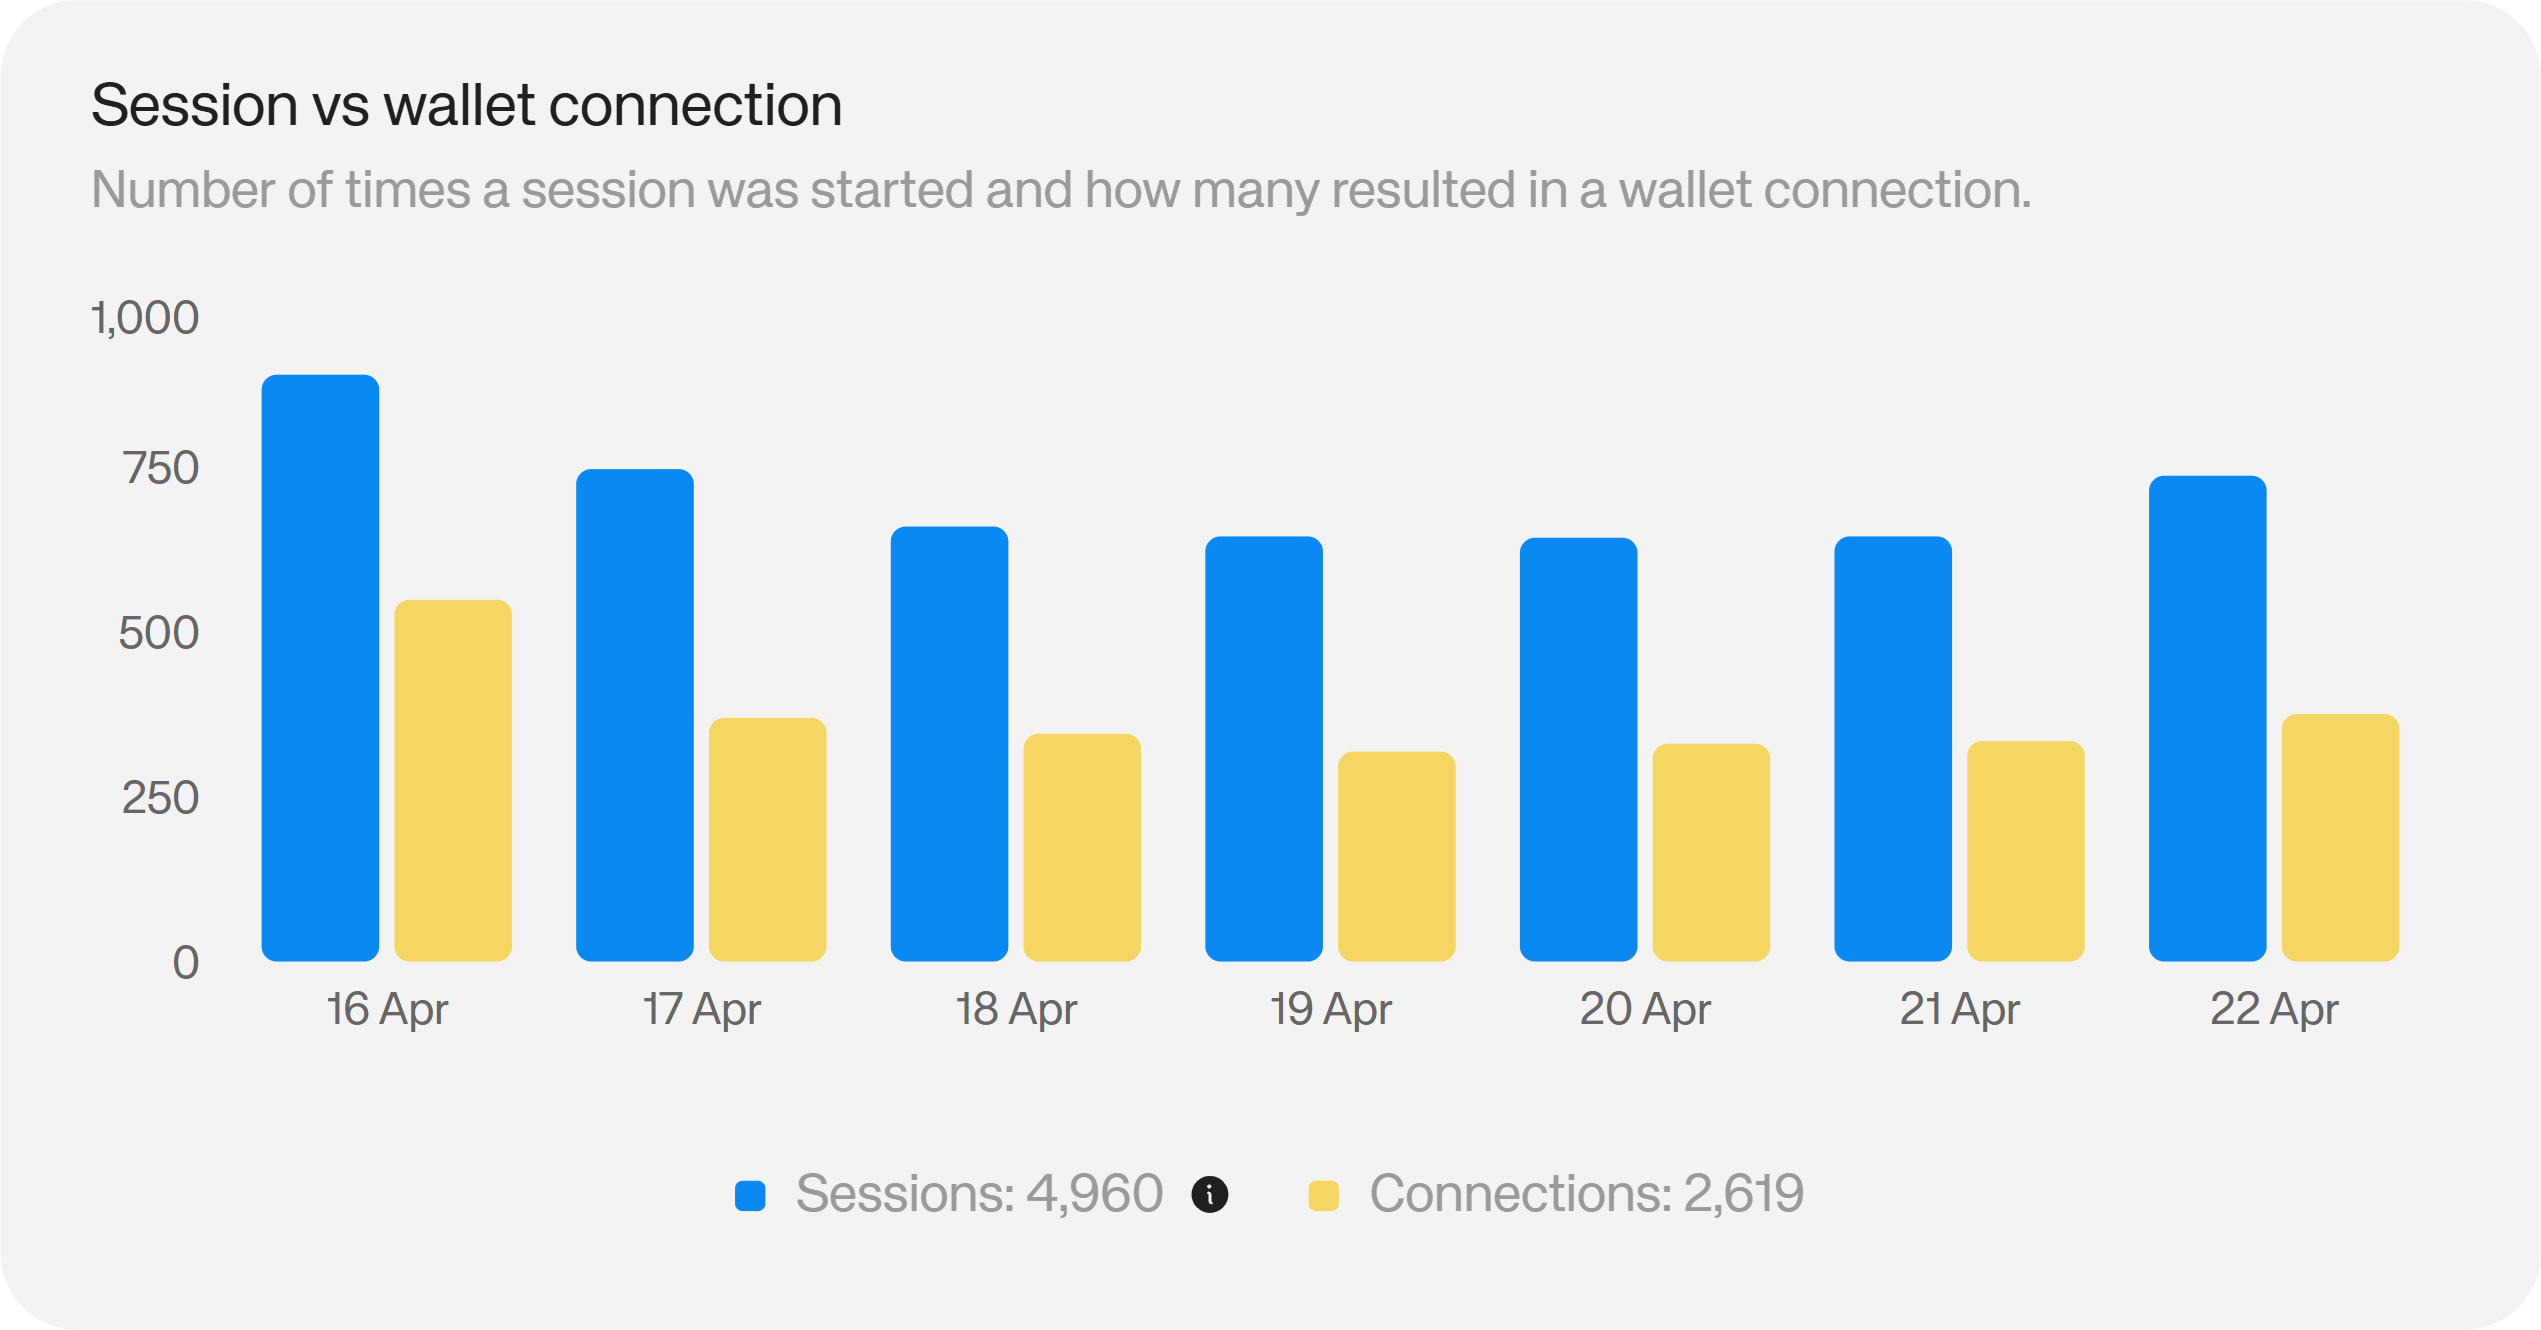
Sessions vs. Wallet Connections
This metric compares the number of times a session was initiated against how many of those sessions resulted in a successful wallet connection.
A large gap between sessions and successful connections is a direct signal of onboarding friction: unclear prompts, unsupported wallets, or connection errors. Closing that gap — through clearer UI, a wider wallet selection, or fallback login methods like email — has a measurable impact on your conversion rate.
Reown's authentication tools include email, social, and wallet-based login, giving users multiple paths to connect rather than a single point of failure.
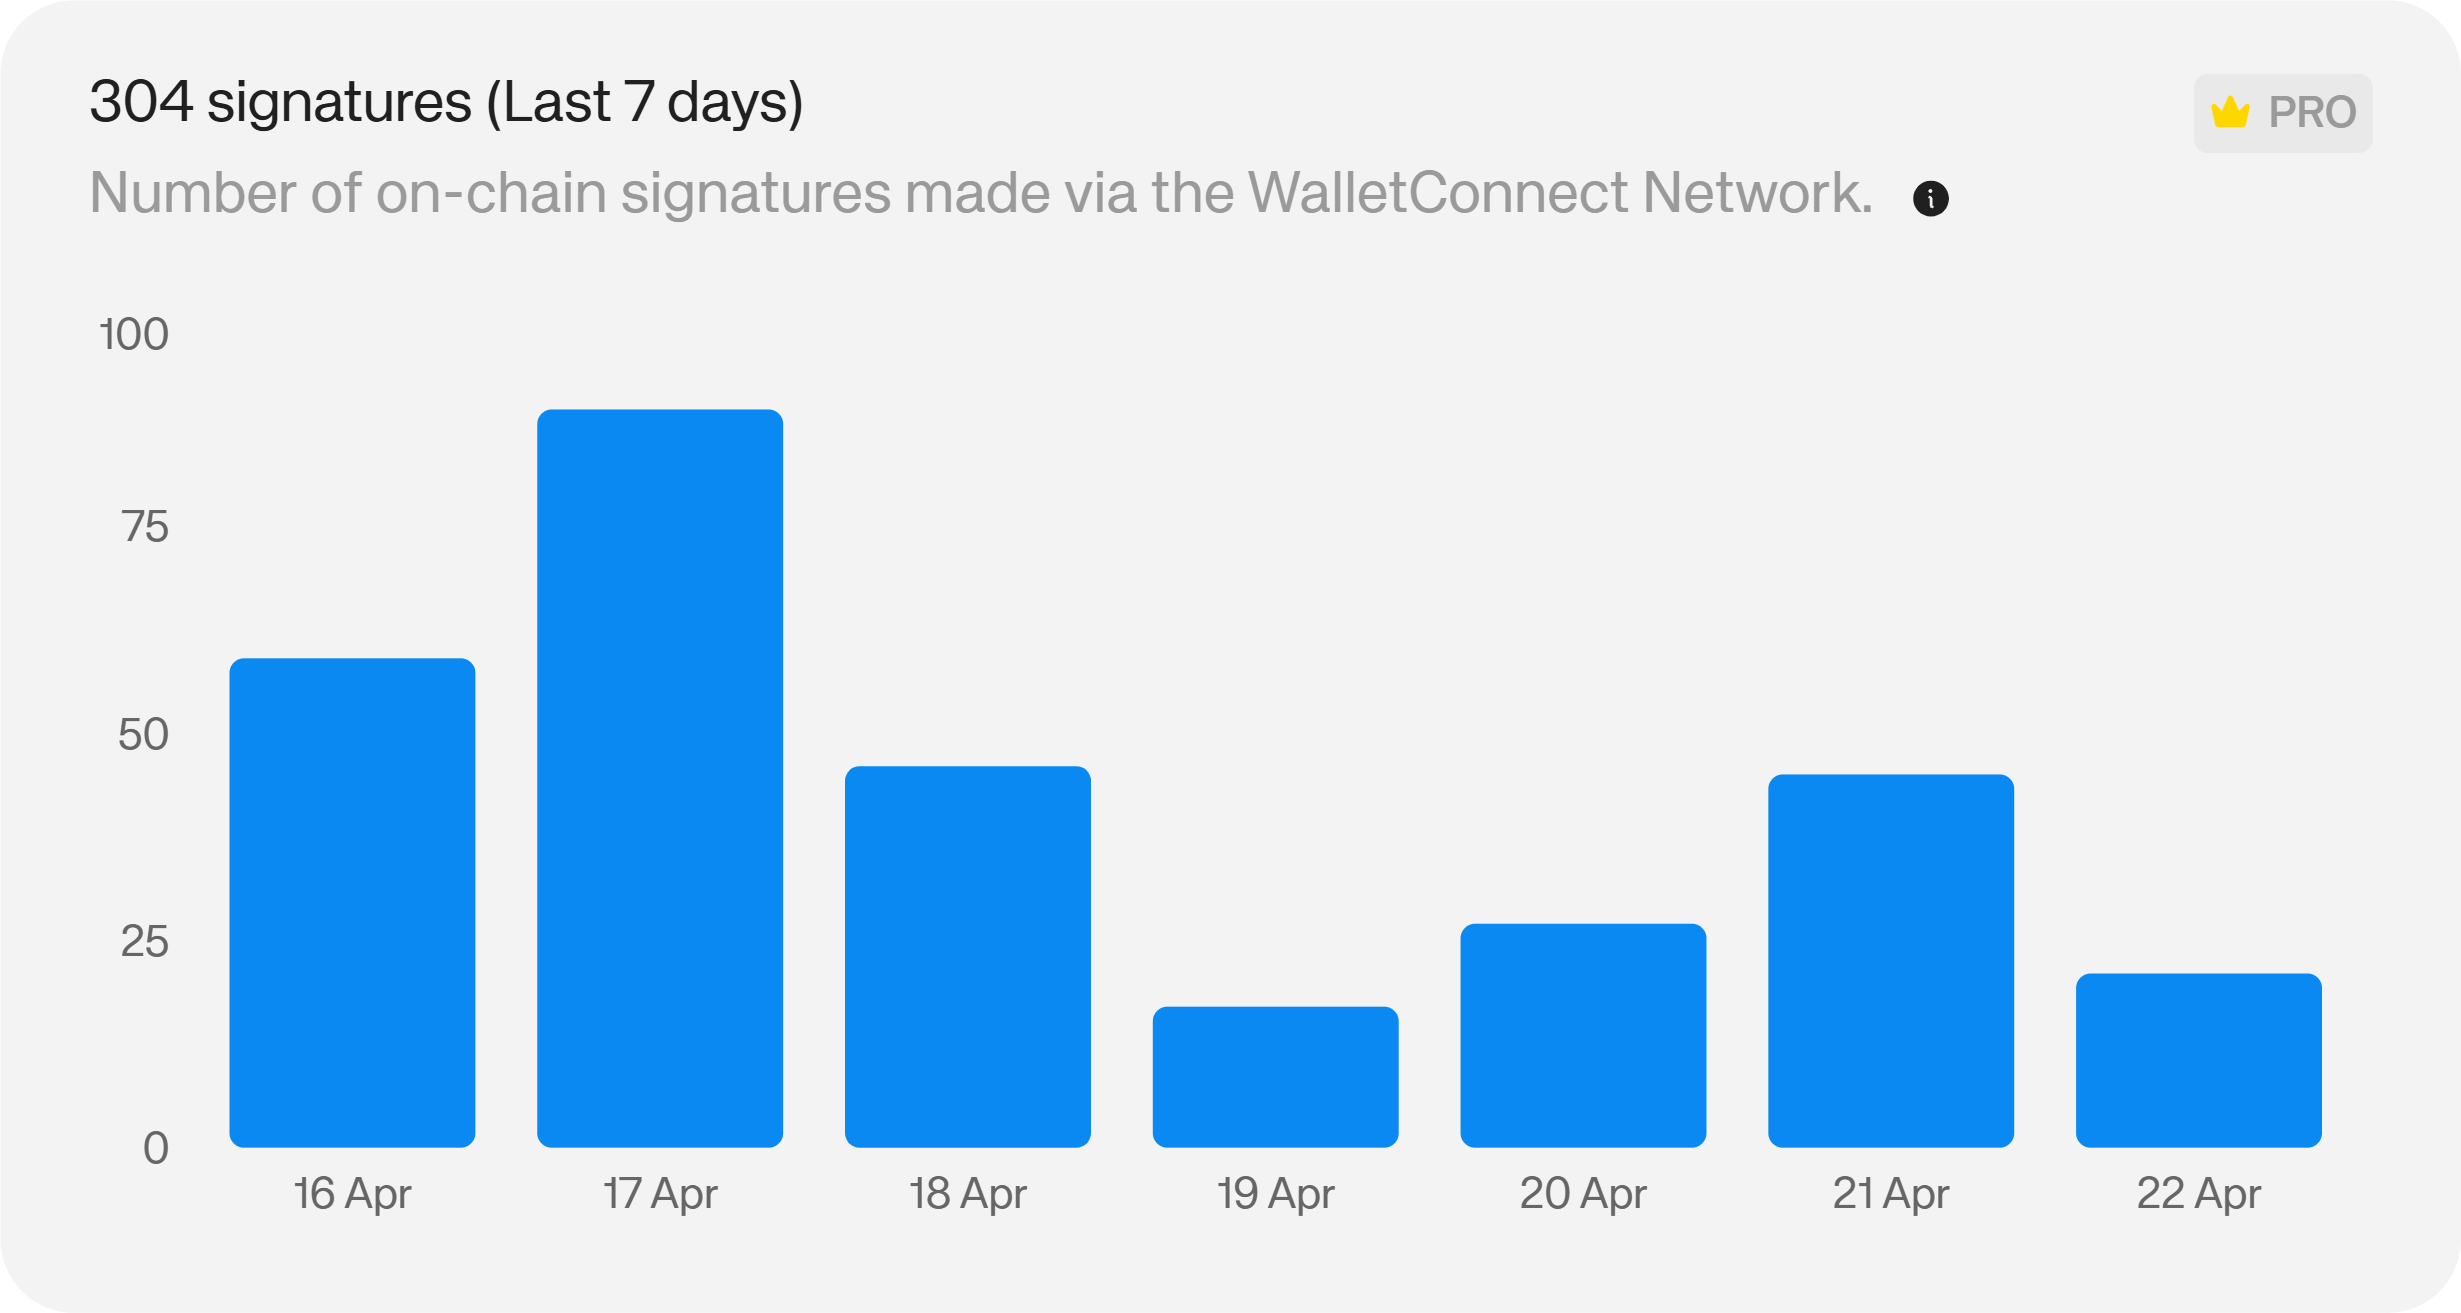
Signatures
Signatures reflects the number of onchain signatures made through the WalletConnect Network while users interact with your app — covering swaps, staking, governance participation, and other onchain actions.
A high signature count indicates that users are moving beyond passive browsing into active onchain engagement. If signature volume is low relative to wallet connections, users are connecting but not transacting — a product or UX issue worth investigating.
Activity Hours
This chart provides an hourly breakdown of when users are most active in your app across the day.
Use peak activity windows to time announcements, incentive drops, and campaign launches for maximum visibility. It also informs infrastructure decisions: if traffic spikes reliably at certain hours, you can plan capacity and monitoring around those windows.

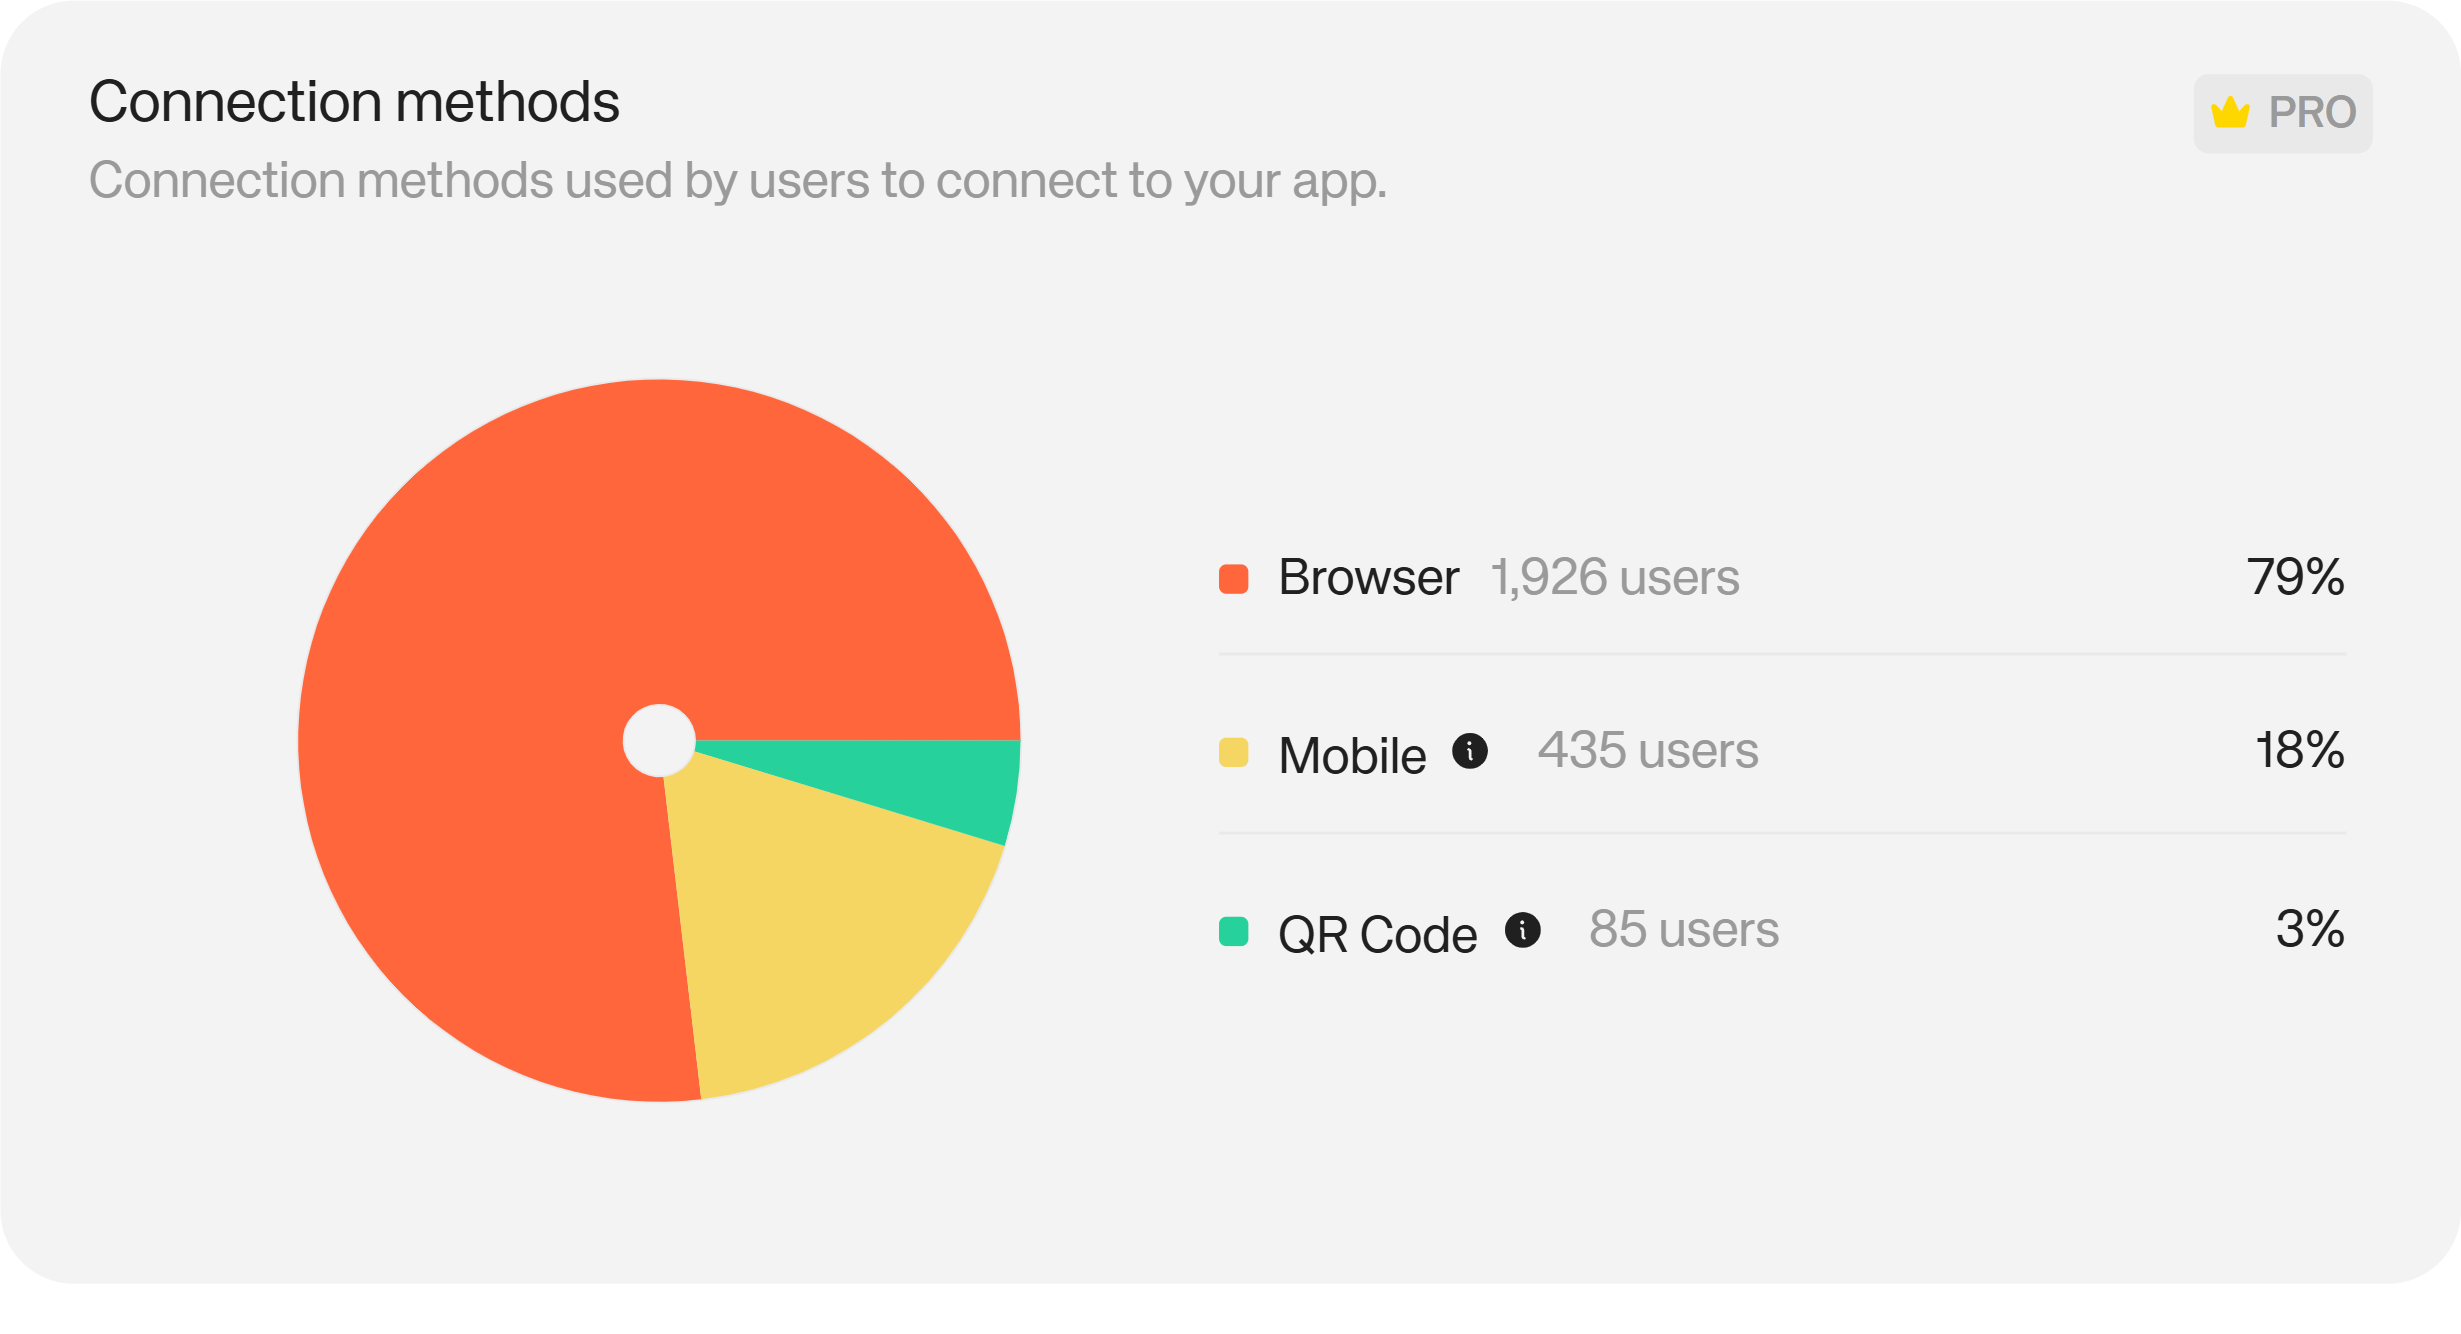
Connection Methods
This metric shows how users are connecting their wallets: QR code, mobile deep link, desktop extension, or other methods.
Understanding which connection methods your users prefer lets you prioritise testing, optimise those flows, and identify methods with disproportionate drop-off. An underused connection method that you expected to perform well is usually a UX or compatibility issue worth diagnosing.
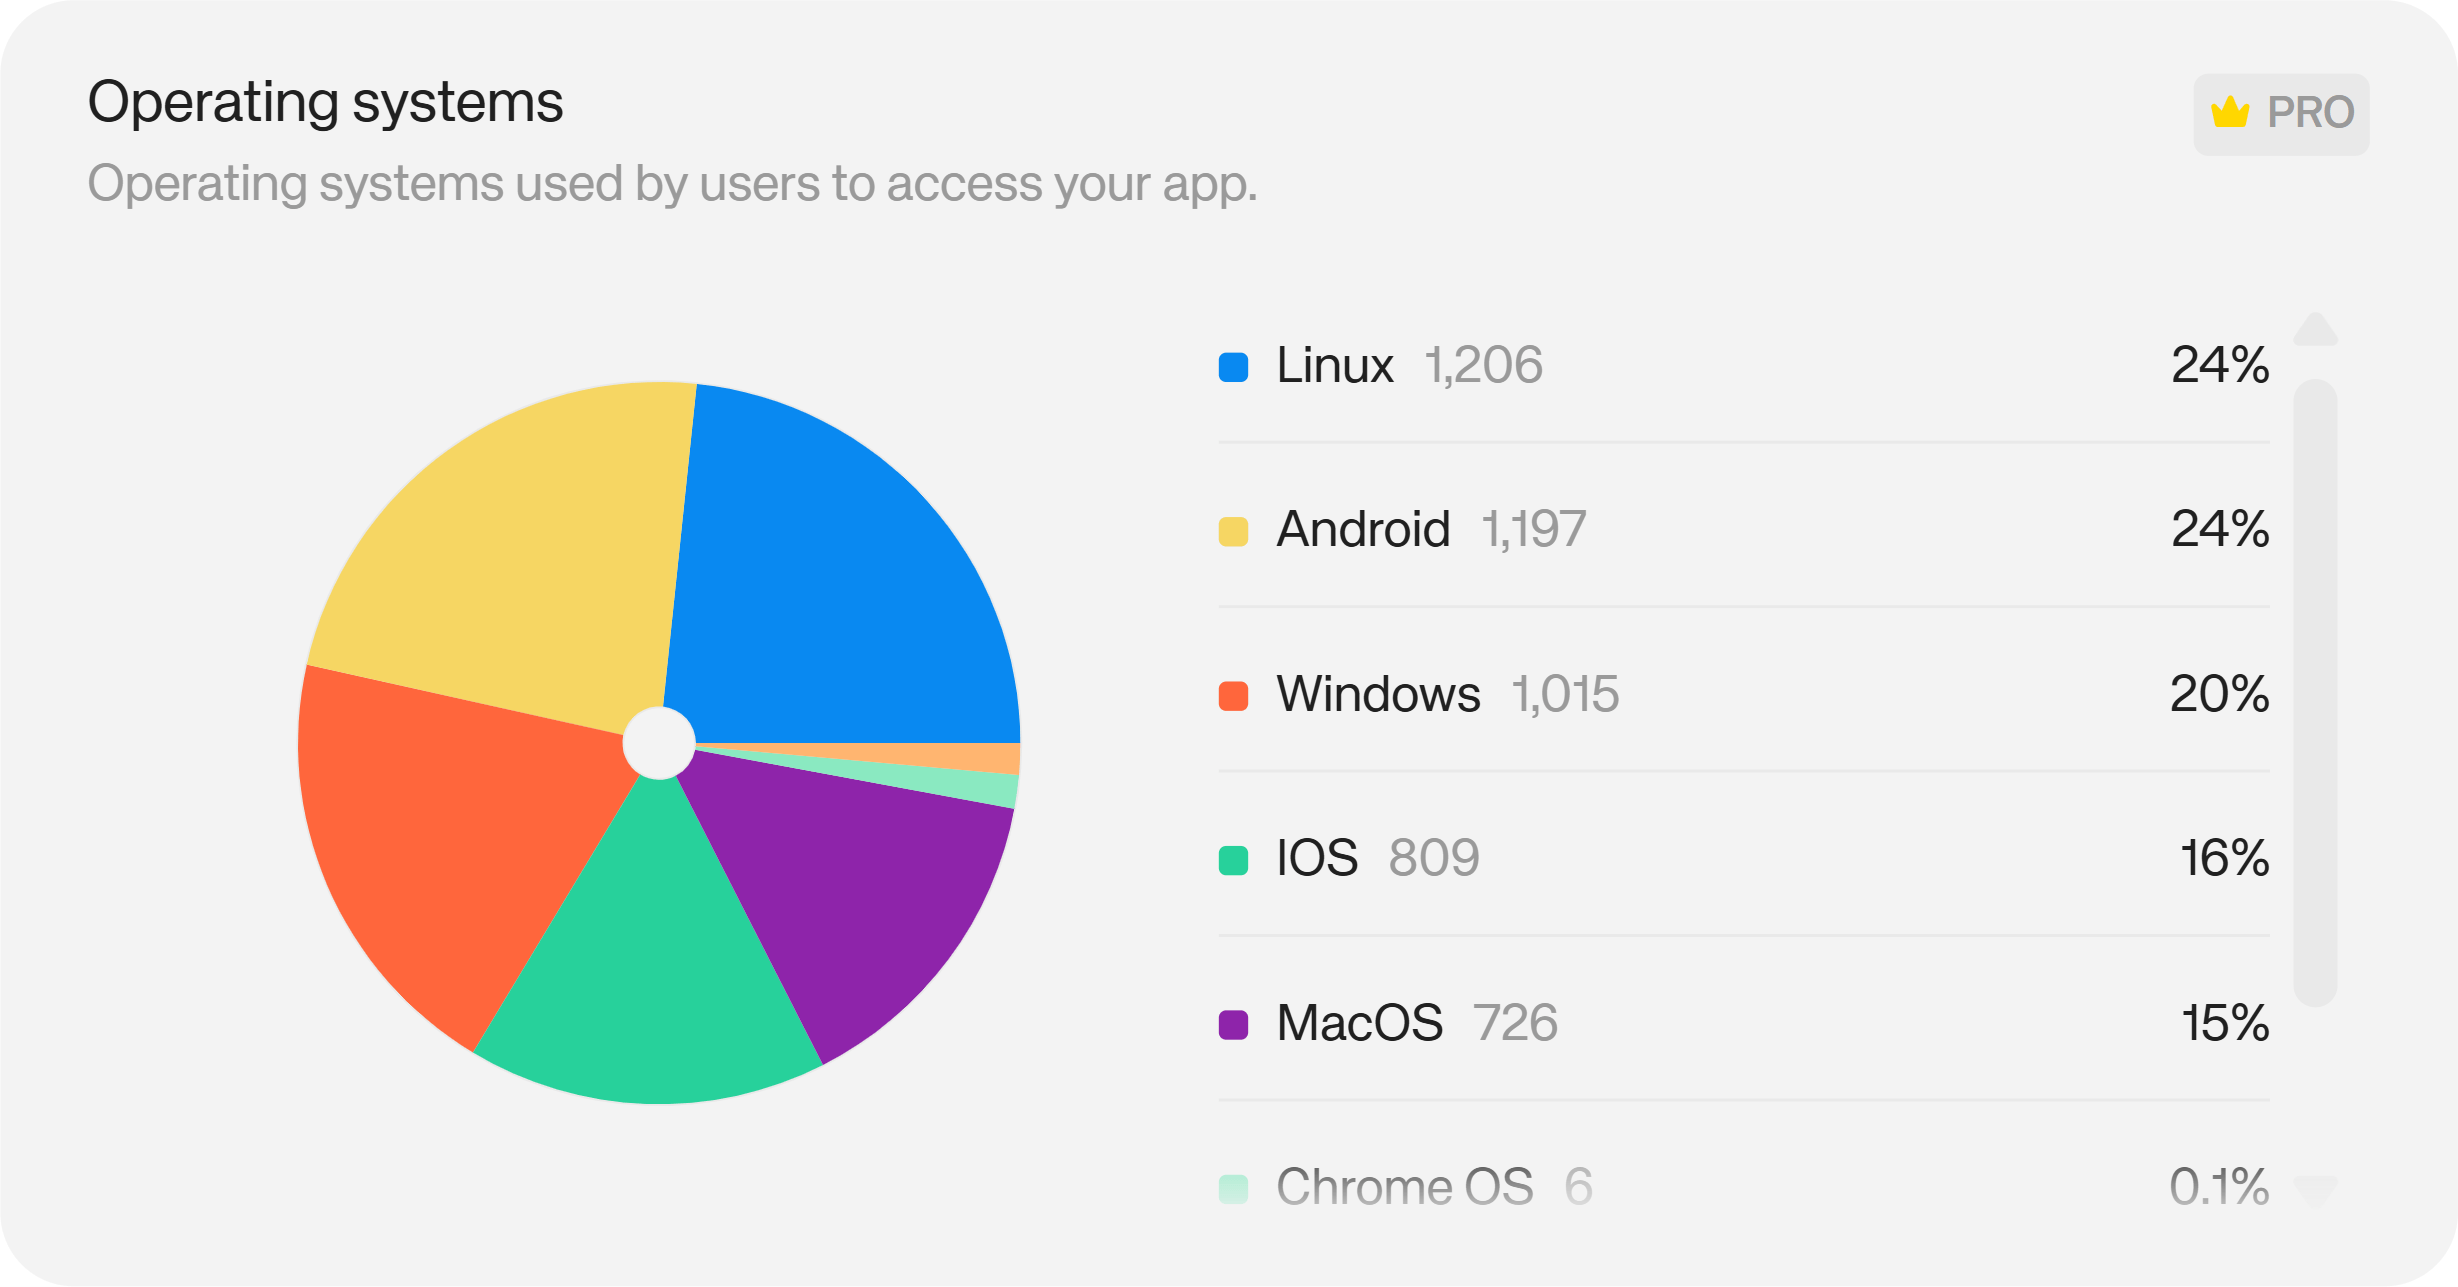
Operating Systems
This metric shows the operating systems and platforms your users are accessing your app from — including iOS, Android, Windows, macOS, Linux, Chrome OS, and others.
If mobile dominates, that's a clear signal to prioritise mobile wallet UX, test on mobile-specific connection flows, and ensure your app renders correctly on smaller viewports. The platform mix also informs your QA priorities — testing time is finite, and this data tells you where it matters most.
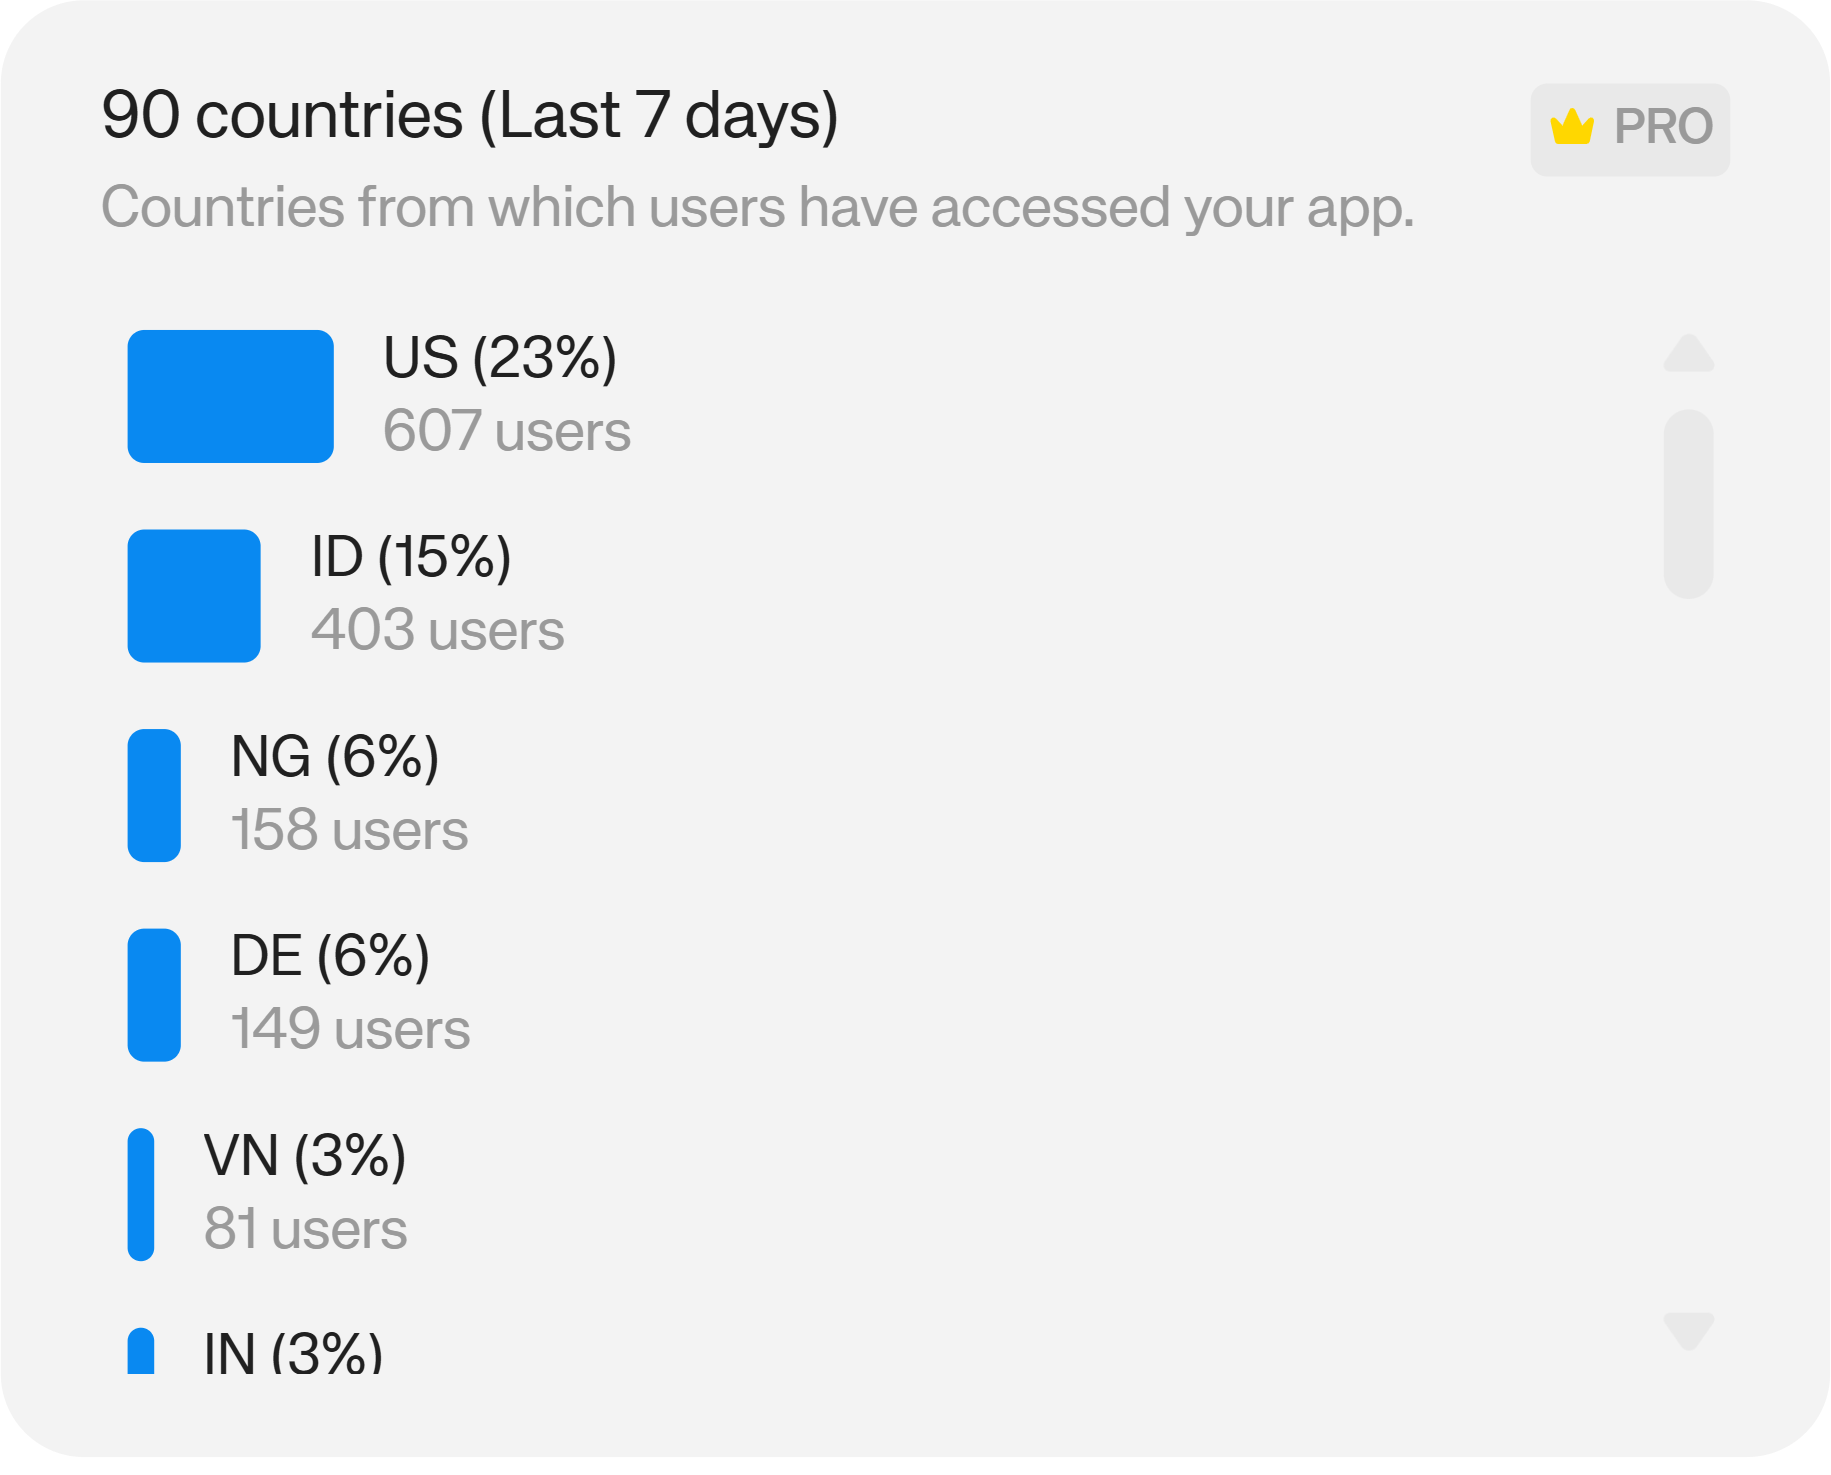
Country Distribution
Country Distribution maps where your users are coming from geographically.
Strong regional concentration is a useful signal for localisation priorities, compliance considerations, and targeted marketing. It can also surface unexpected growth in markets you haven't actively targeted — which is often worth acting on. Reown's compliance tooling can help teams navigate jurisdiction-specific requirements where relevant.
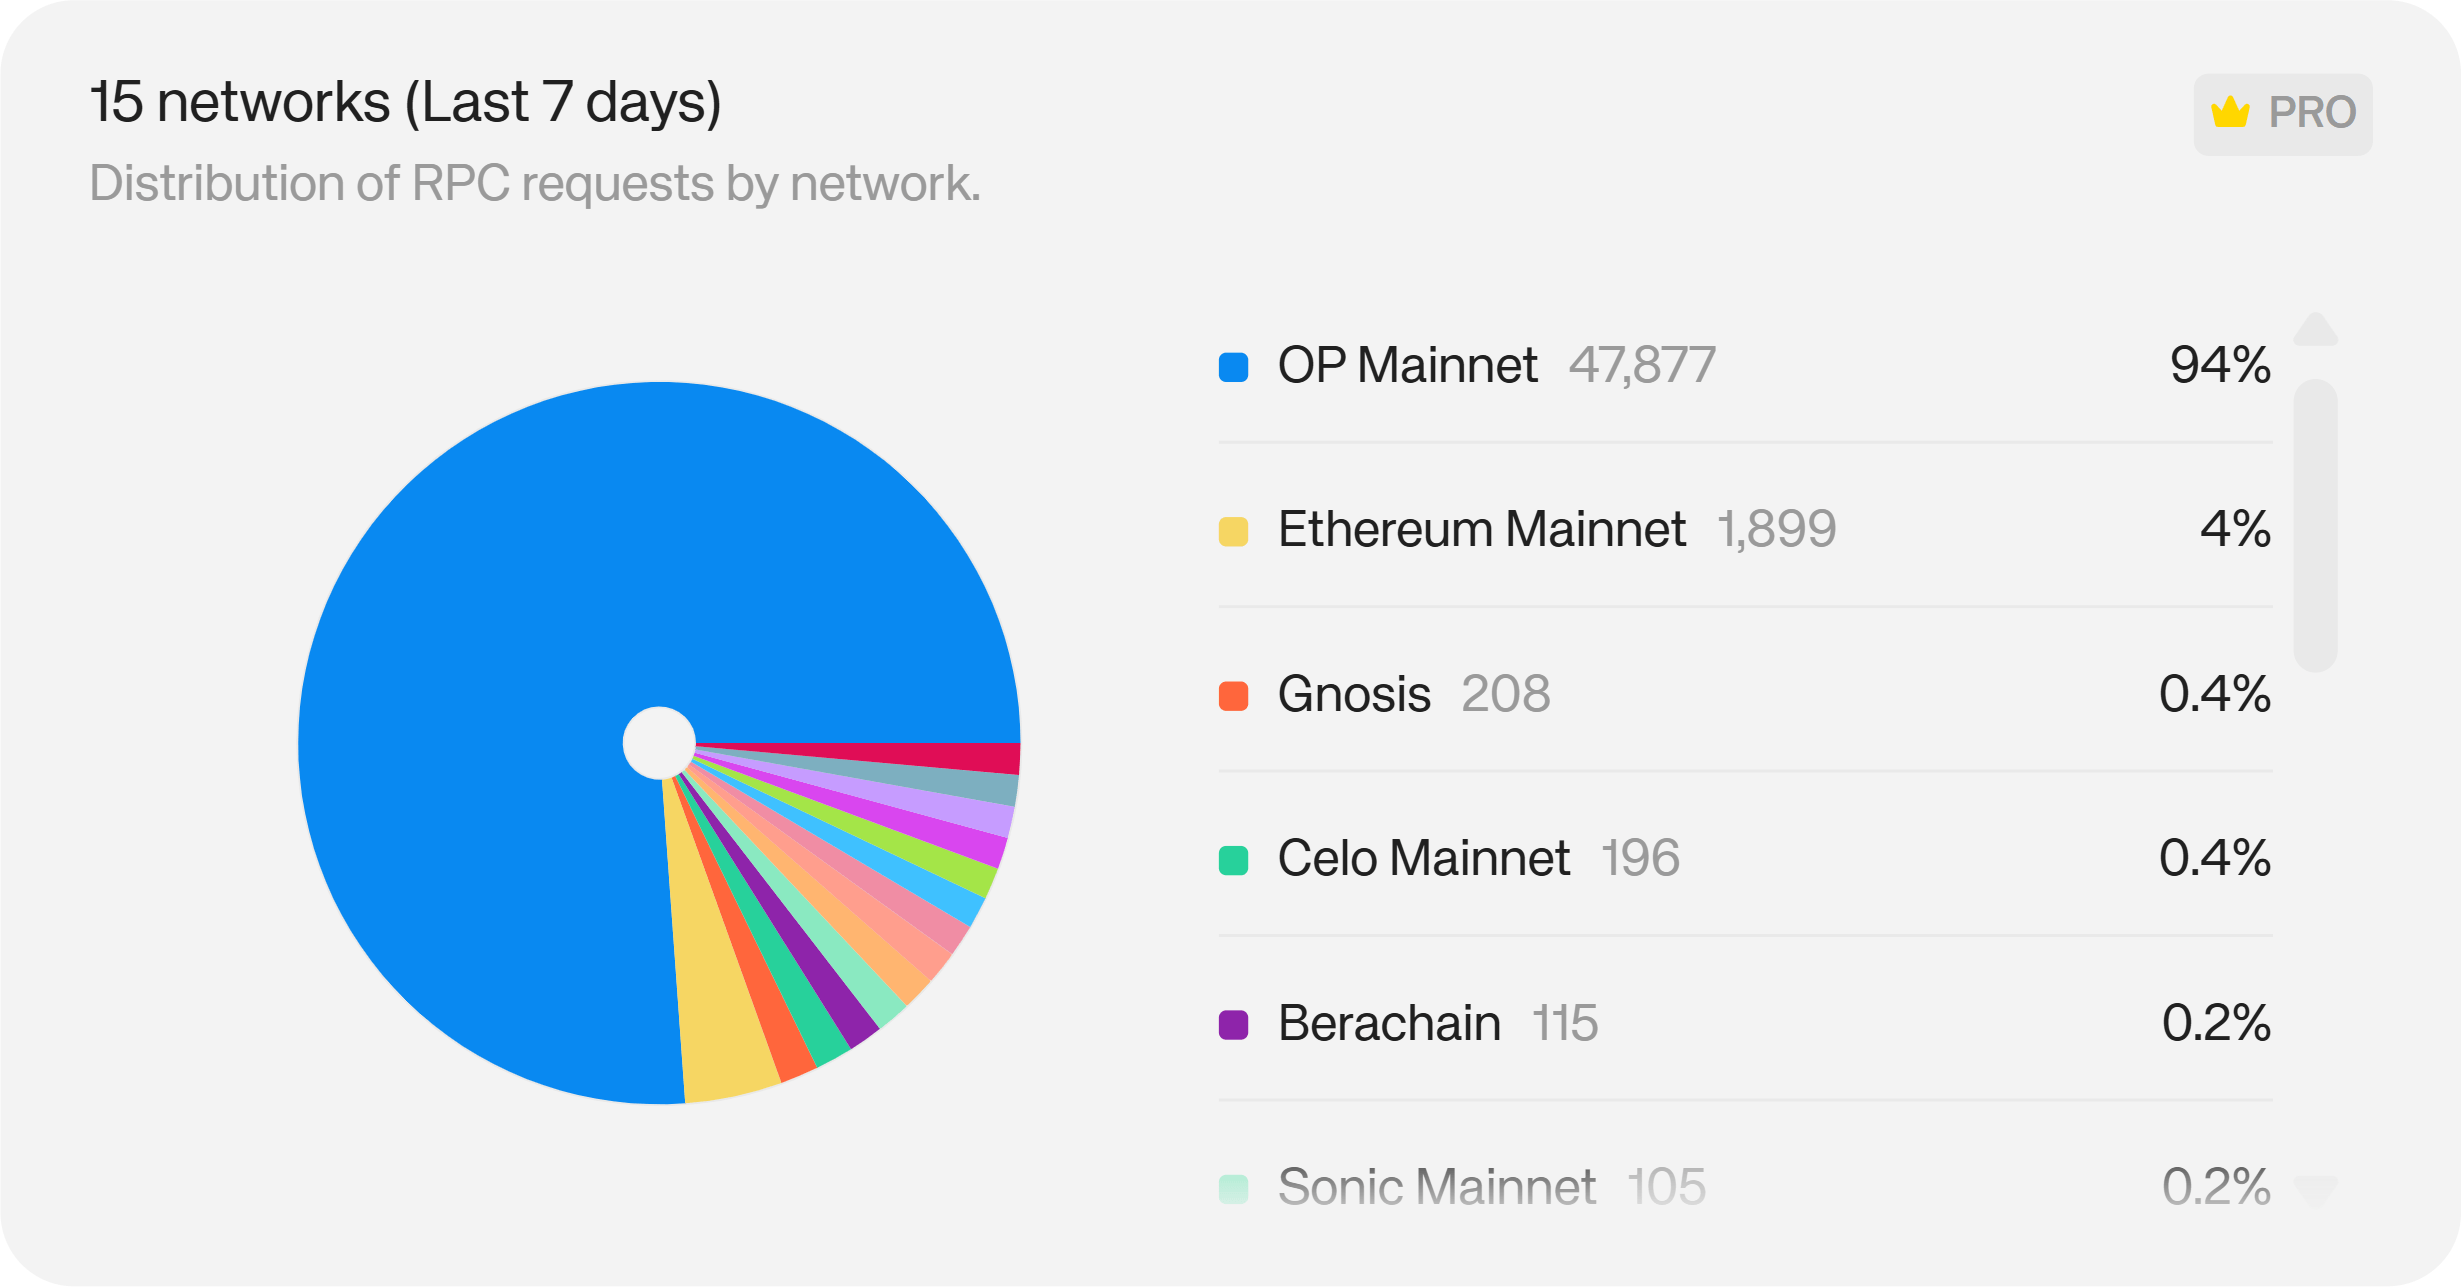
Networks
Networks shows which blockchain networks your users are connecting to during their sessions — Ethereum Mainnet, Optimism, Arbitrum, Base, and others.
A spike in a particular network suggests where your audience is most active onchain. That data should feed directly into ecosystem decisions: where to prioritise features, which network-native incentives to explore, and where to direct partnership efforts.
Login Methods
This metric shows which authentication methods users are choosing to sign in to your app — wallet-based, email, social, or others.
Understanding login method distribution helps you optimise the flows users prefer, reduce drop-off for new users who may not have a wallet ready, and ensure fallback options are reliable. If a significant portion of users are signing in with email or social accounts, that's a signal that social login is opening your app to users who would otherwise have bounced.
Reown's Email & Social Login supports Google, X, Discord, GitHub, Apple, and Farcaster out of the box, with no custom OAuth configuration required.
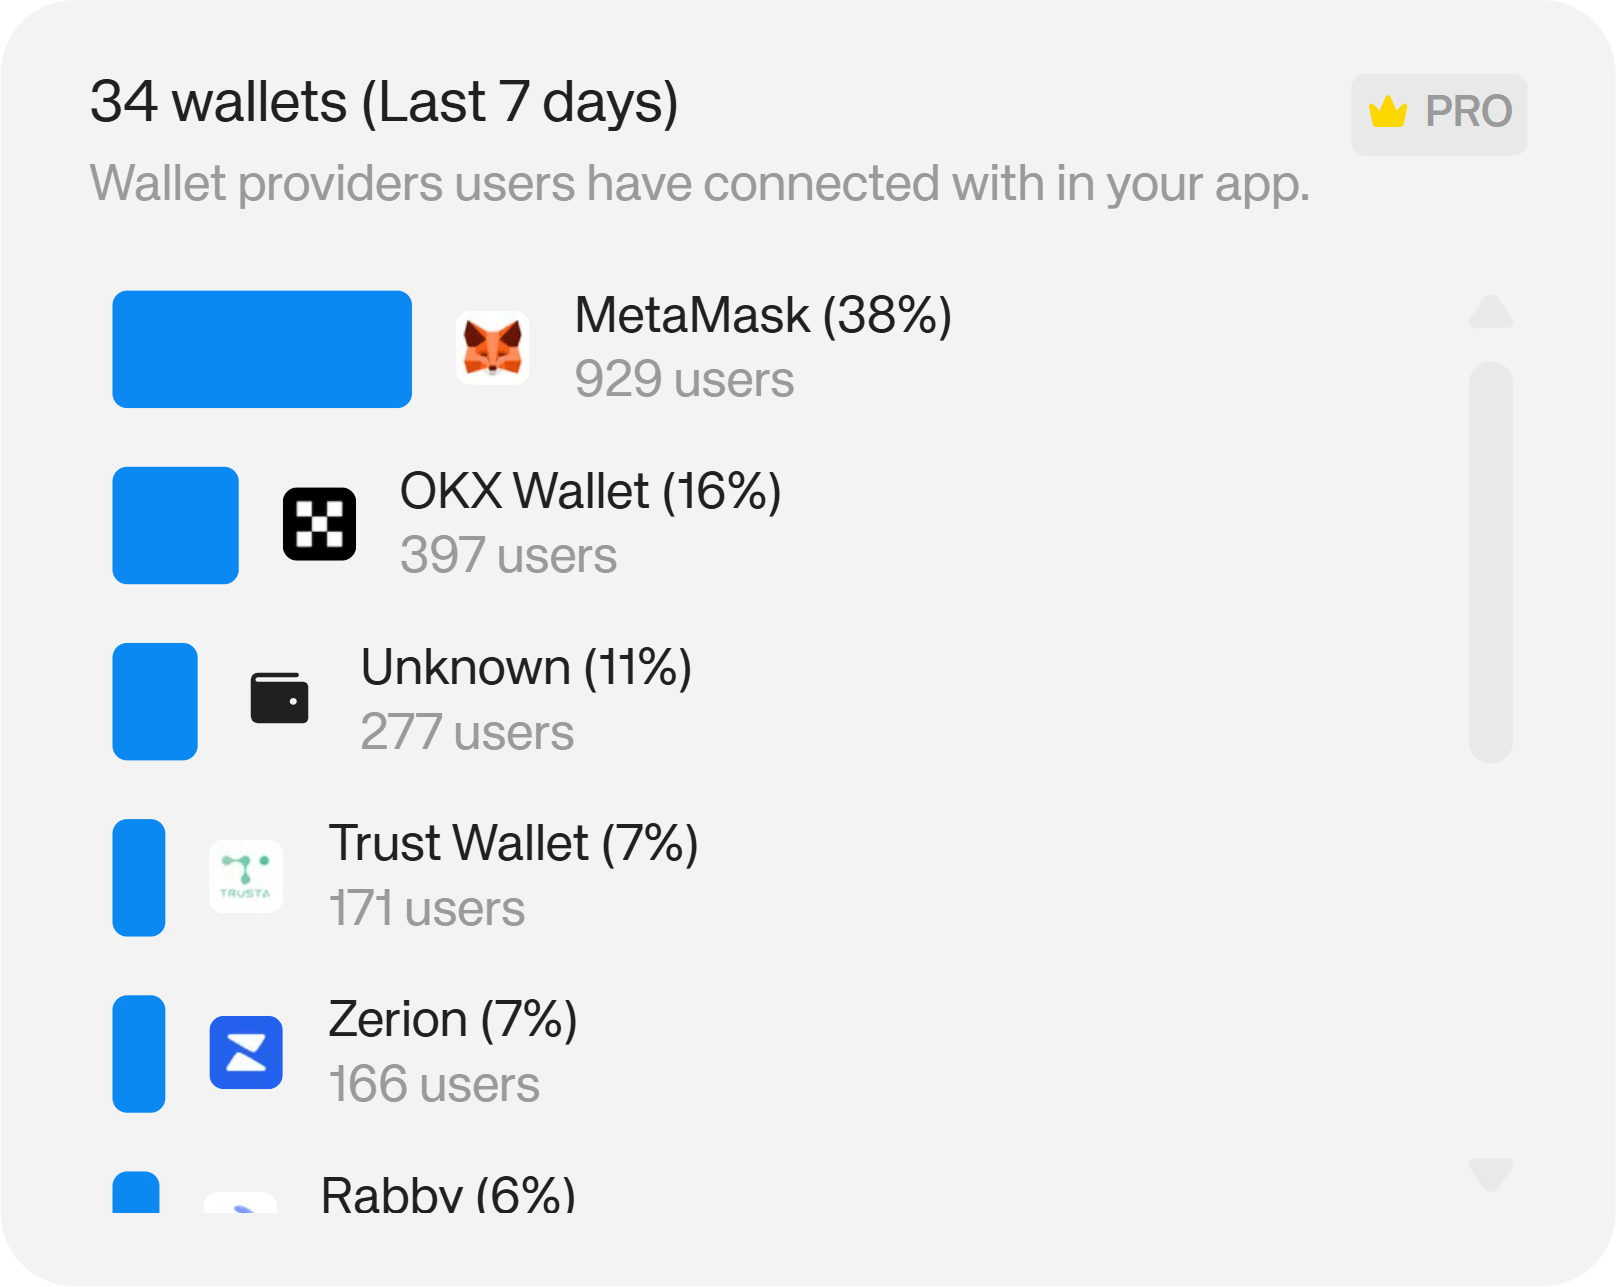
Wallets
Wallets shows which wallet providers your users are connecting with — MetaMask, Rabby, OKX, Trust Wallet, and others.
If a large share of your users connect via a specific wallet, ensuring a flawless experience with that wallet should be a testing priority. It can also surface co-marketing or partnership opportunities — a shared audience is a natural starting point for that conversation.
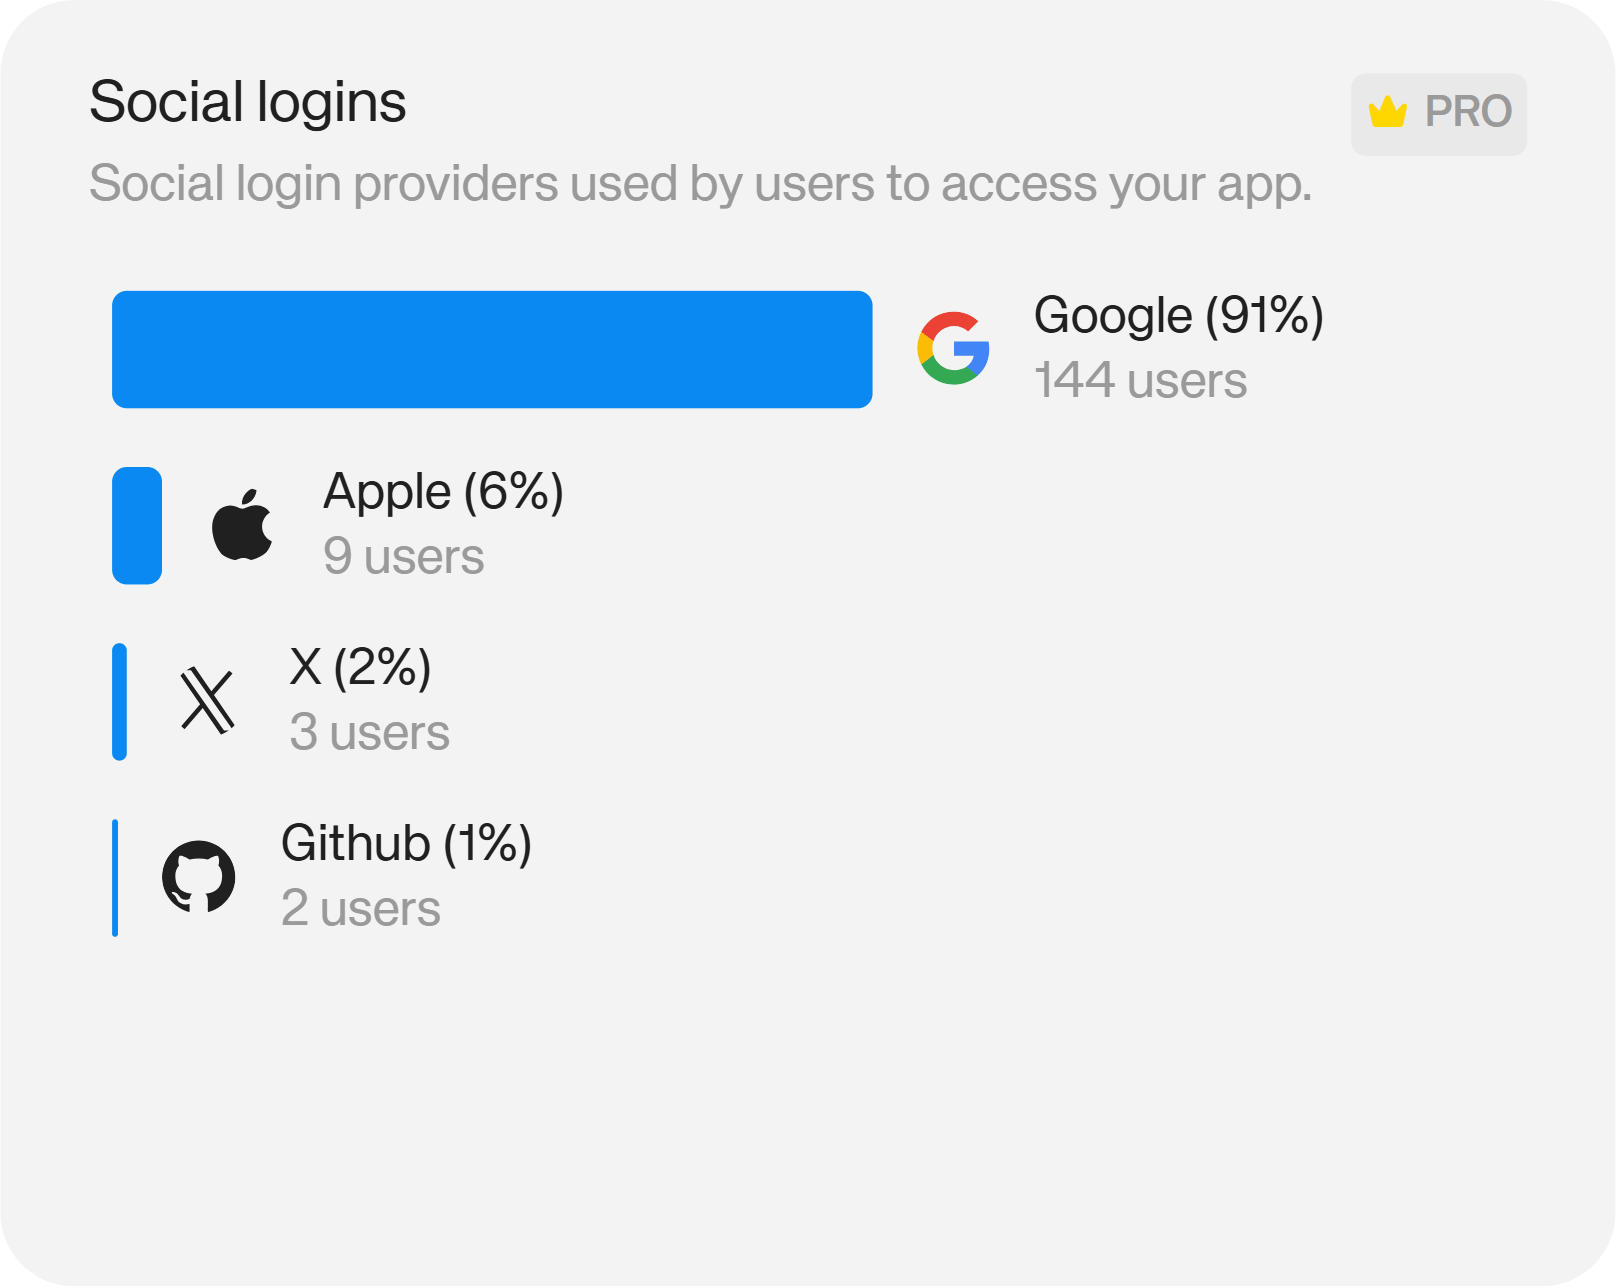
Social Login
Social Login breaks down which social login providers users are relying on to access your app: Google, Twitter/X, Discord, GitHub, and others.
If Discord logins dominate, that tells you where your user community is actually congregated — and where community engagement efforts will have the most reach. Aligning your communication channels with where your users already spend time has a meaningful impact on retention.
Swaps Activity
Navigate to Analytics → Swaps to access swap-specific metrics.
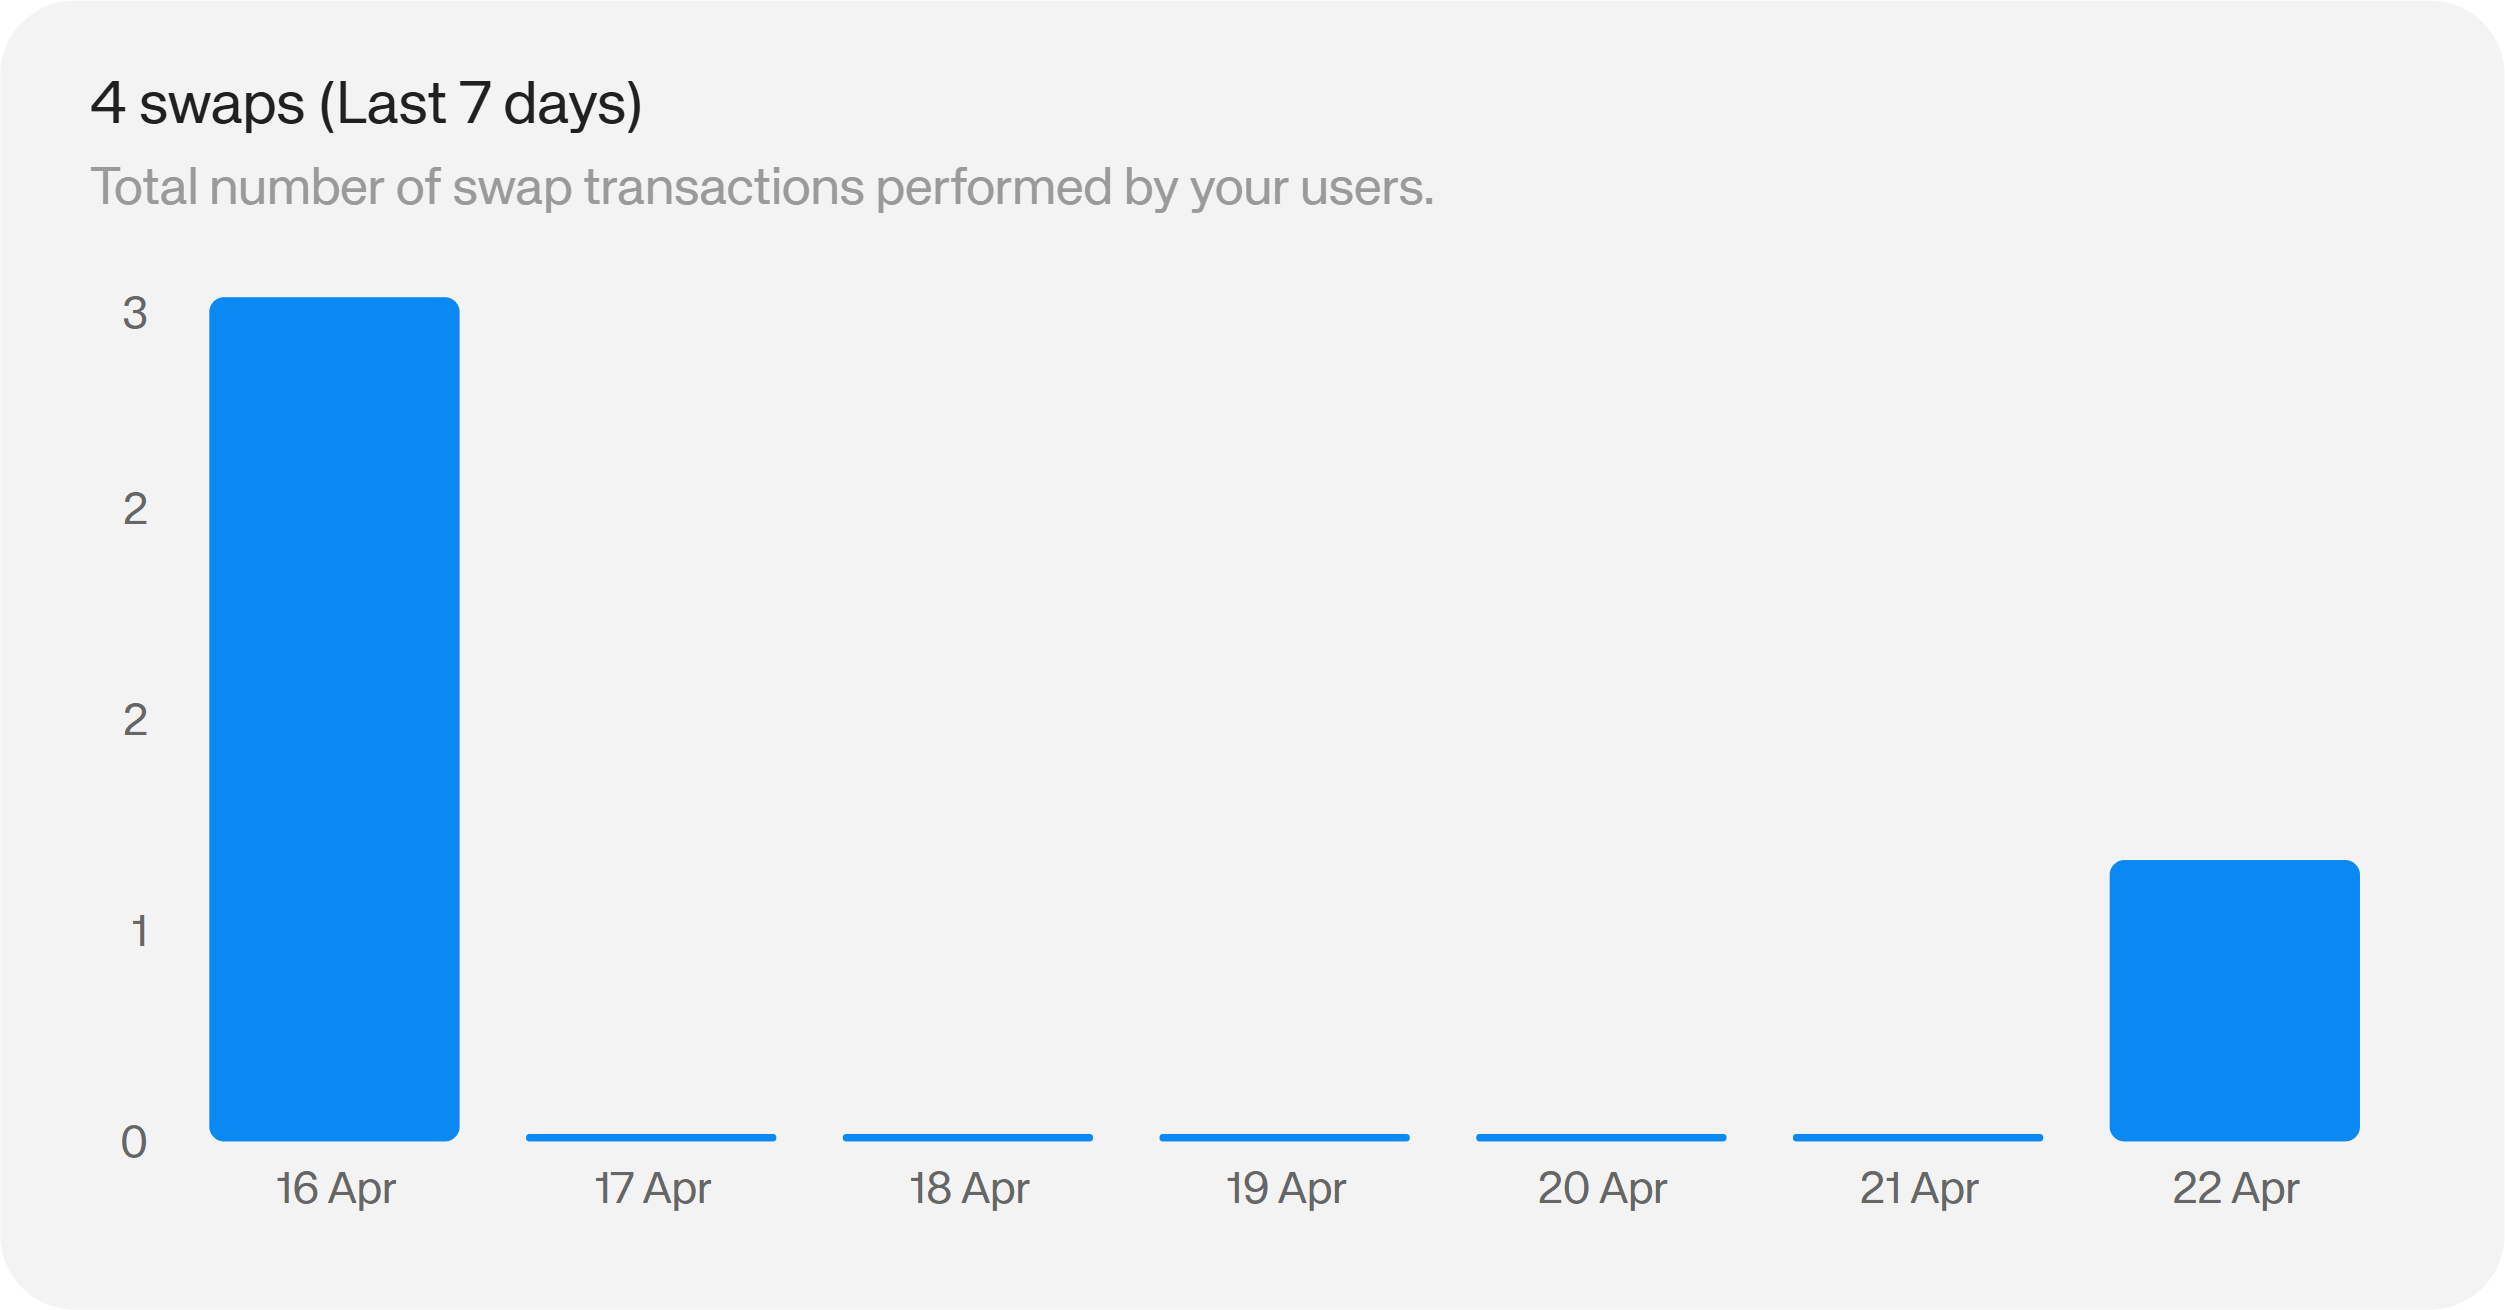
Total Swaps
Tracks the total number of swap transactions performed by users within your app. High swap volume indicates active engagement with your trading features. Low swap volume despite strong wallet connections suggests friction in the swap flow, limited liquidity, or a mismatch between the pairs available and what users want to trade.
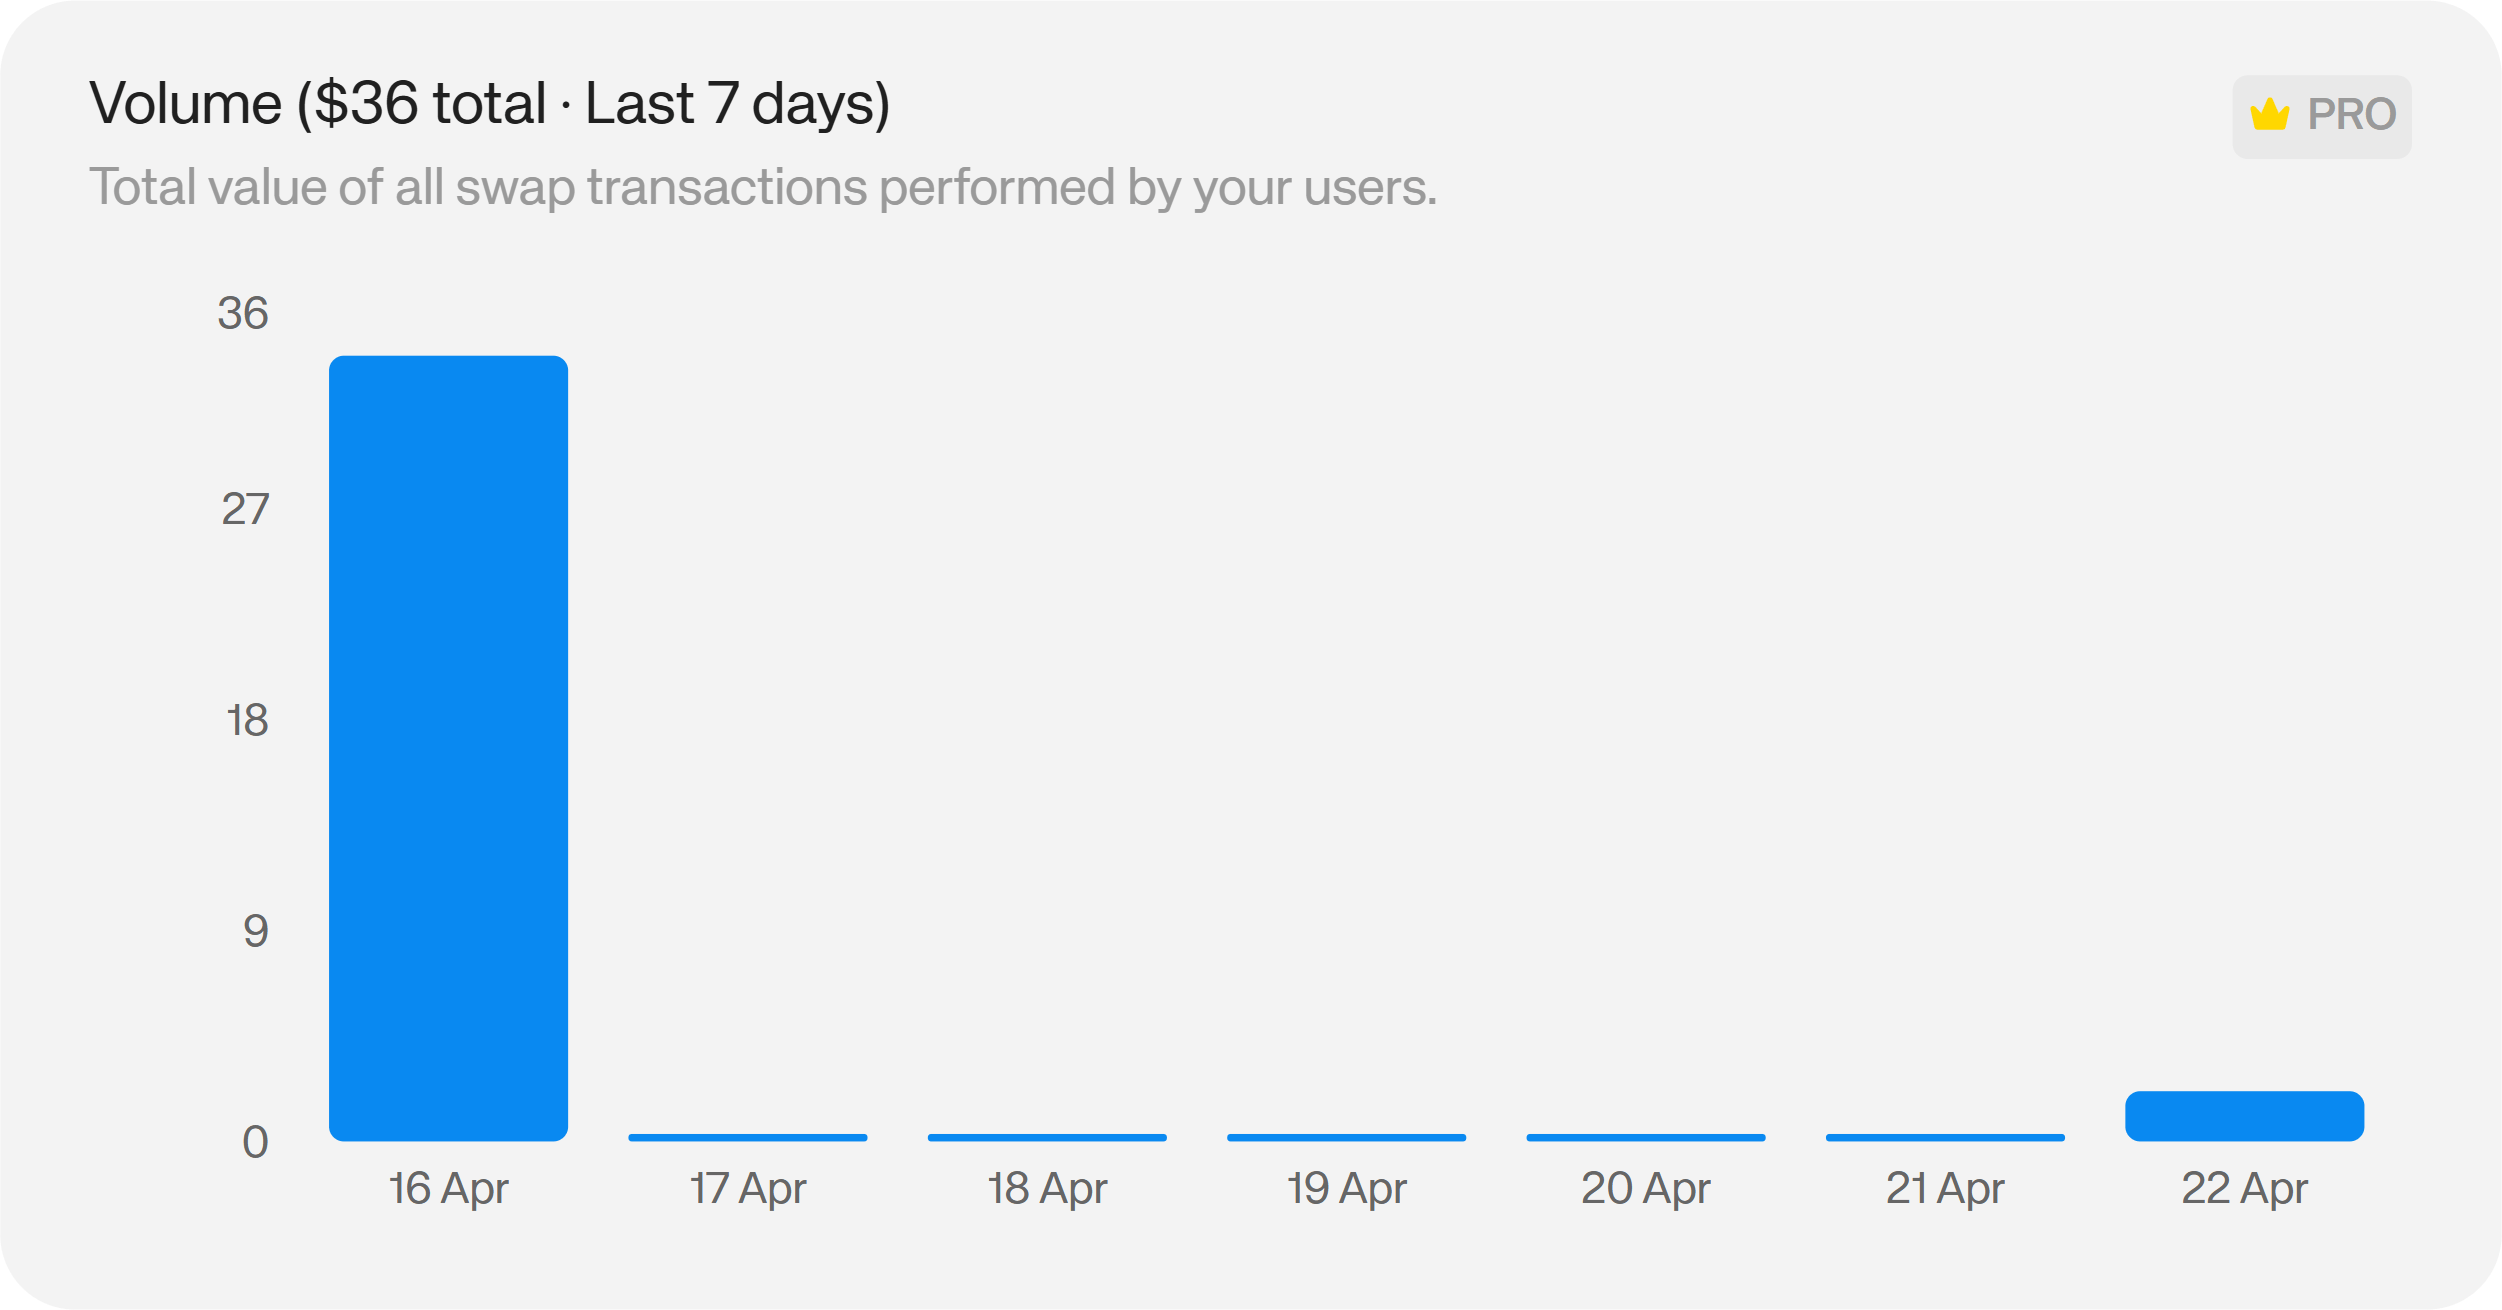
Swap Volume
Measures the total value of all swap transactions. High volume with relatively few transactions points to a power user base running larger trades; high transaction count with low volume suggests smaller, more frequent trades. Both patterns inform different product and incentive strategies.
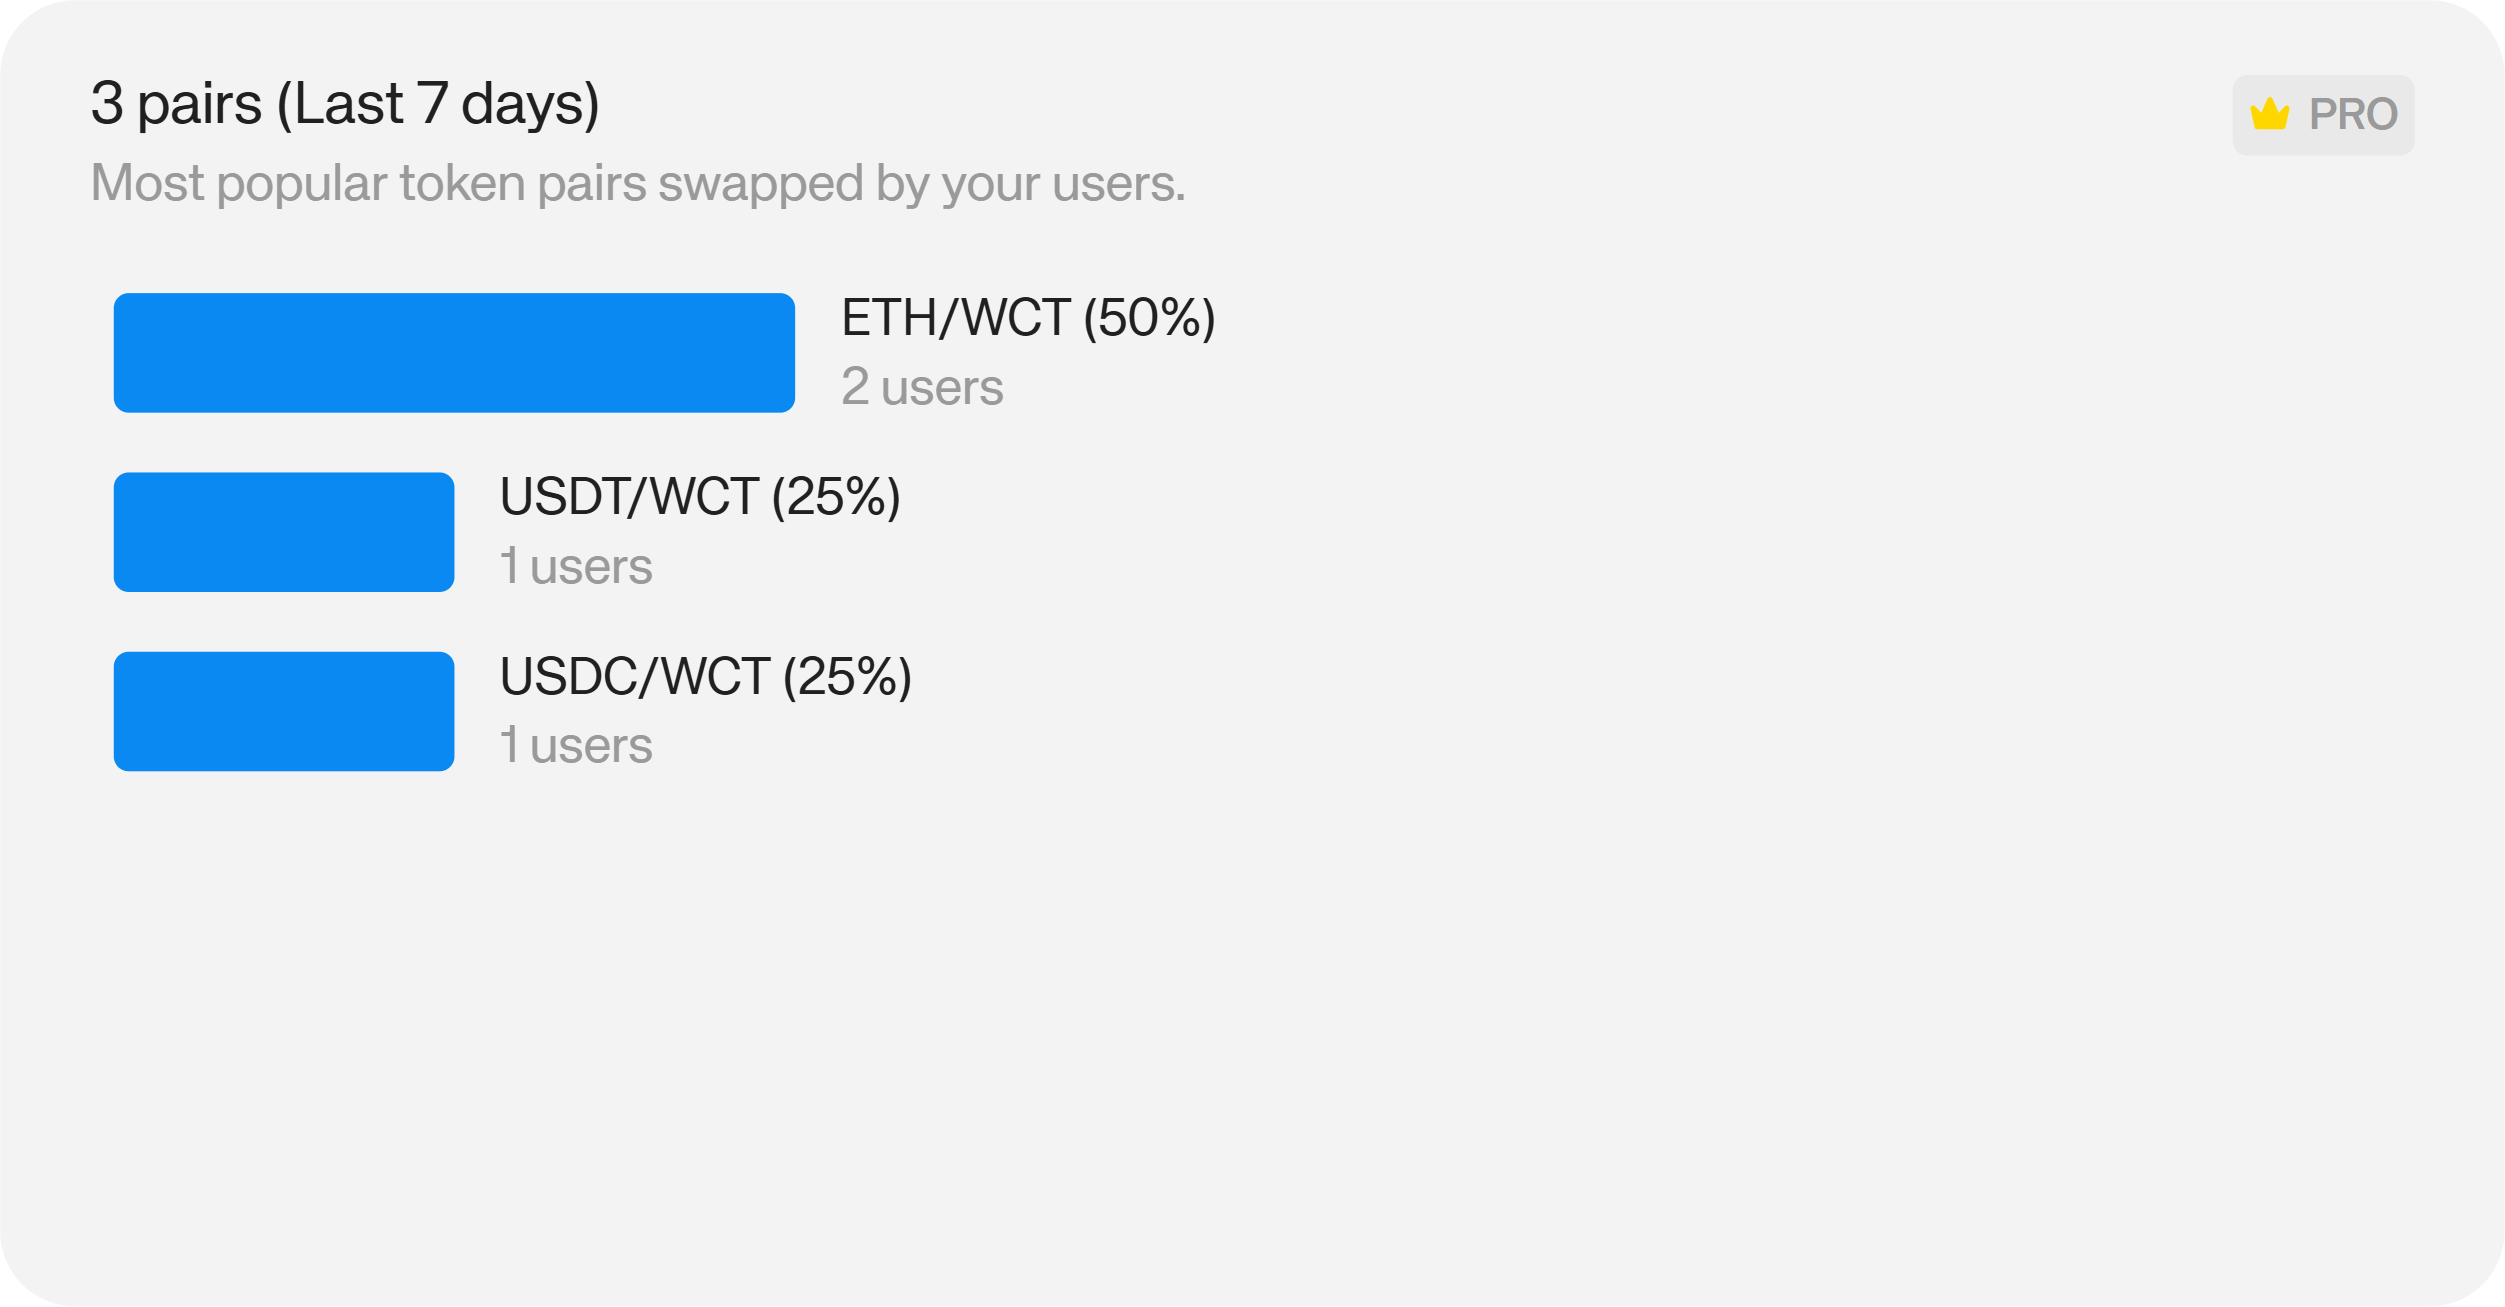
Trading Pairs
Identifies the most-used token pairs in your app. Knowing which pairs drive the majority of volume helps you prioritise liquidity support, improve routing for high-demand pairs, and design incentive programmes around the assets your users actually want to trade.
Countries
Shows the geographic distribution of swap activity — where your trading users are located. Regions with high swap concentration may warrant localised stablecoin pair support, regional liquidity partnerships, or compliance review depending on regulatory context.
Reown's swap integration handles routing automatically in-app, with no need for users to navigate to a separate DEX.

Onramp Activity
The Onramp section provides equivalent analytics for fiat-to-crypto onramp activity within your app — covering transaction volume, geographic distribution, and conversion rates for users funding their wallets directly from a card or bank transfer.
Reown's onramp feature lets users purchase crypto without leaving your app, which removes one of the most common reasons new users abandon the onboarding flow before completing their first transaction.
Users
Navigate to the Users tab in the dashboard to access authenticated user data for specific projects.
Authenticated Users
This section gives you a view of users who have signed in to your app through Reown authentication — including their activity status and authentication method.
Tracking authenticated users separately from anonymous sessions allows you to distinguish between one-time visitors and users who have committed to your app enough to sign in. A steady rise in authenticated users is one of the stronger signals of product-market fit: it means users are returning and re-engaging rather than dropping off after a single visit.
Reown's SIWE (Sign-In with Ethereum) and SIWX multichain authentication give users a cryptographically secure way to authenticate that doesn't rely on a username and password.
RPC Calls
RPC tracks the volume and distribution of blockchain API requests made by your app — broken down by chain ID, method, and country. If you're using Reown's Blockchain API as your RPC layer, this gives you visibility into exactly how your app is reading and writing to the blockchain.
Build with Real Data Behind You
Reown Analytics gives onchain teams the user, session, network, wallet, and transaction data they need to make decisions — without stitching together separate tools or writing custom tracking logic. If you're already integrated with the Reown SDK, your analytics infrastructure is already in place.
Explore your dashboard at dashboard.reown.com, or read more about how Reown handles authentication, payments, and analytics for onchain apps.