Enterprise Analytics Just Leveled Up: Here's what's new
Reown has expanded its Enterprise Analytics offering with three powerful new capabilities: app co-usage charts, user net worth segmentation, and Wallet Intelligence — giving growing teams the onchain context they need to understand, segment, and act on their user base.
We're thrilled to announce a significant expansion of Reown Analytics for Enterprise users: two new charts and extended Wallet Intelligence features for your user base; extending your user insights far beyond in-app behaviour into the full picture of your users' onchain activity.
What's new in Enterprise Analytics?
Three new capabilities are now live for Enterprise teams in the Reown dashboard.
App Co-Usage Chart
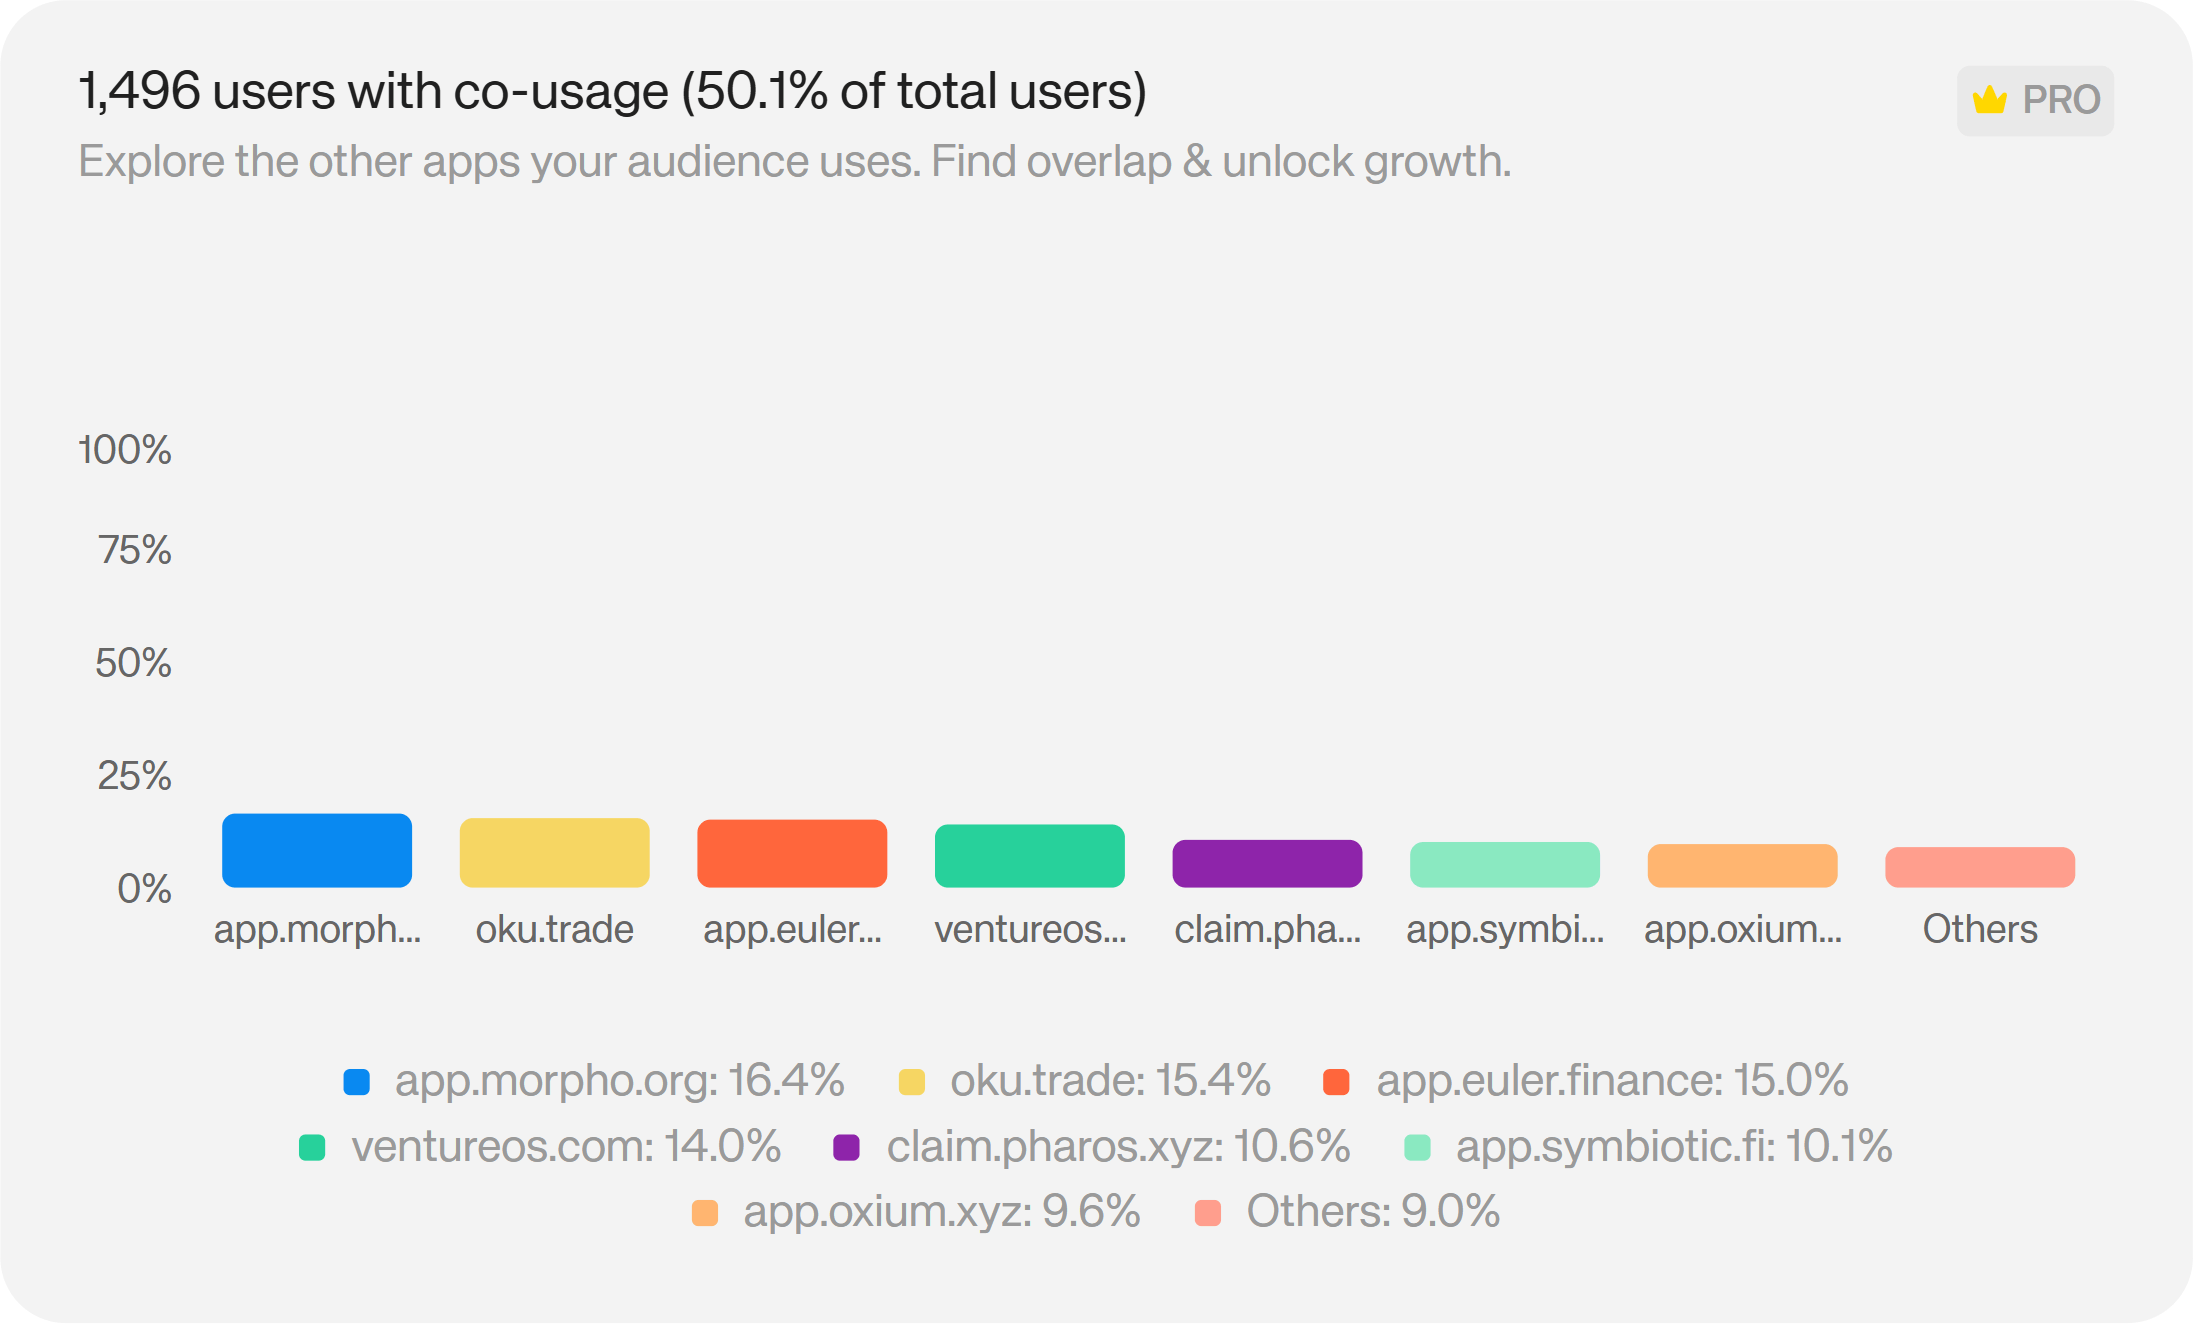
Found under the User Activity tab, the App co-usage chart shows which other apps your connected users are using — ranked from most to least popular. If most of your users are active in other categories of apps, whether yield farming, lending protocols, or onchain social, you'll see it here. This isn't just interesting data: it's a direct signal about what features and content your audience is already drawn to. The idea is that you can use this data to ship features your users want and need.
User Net Worth Chart
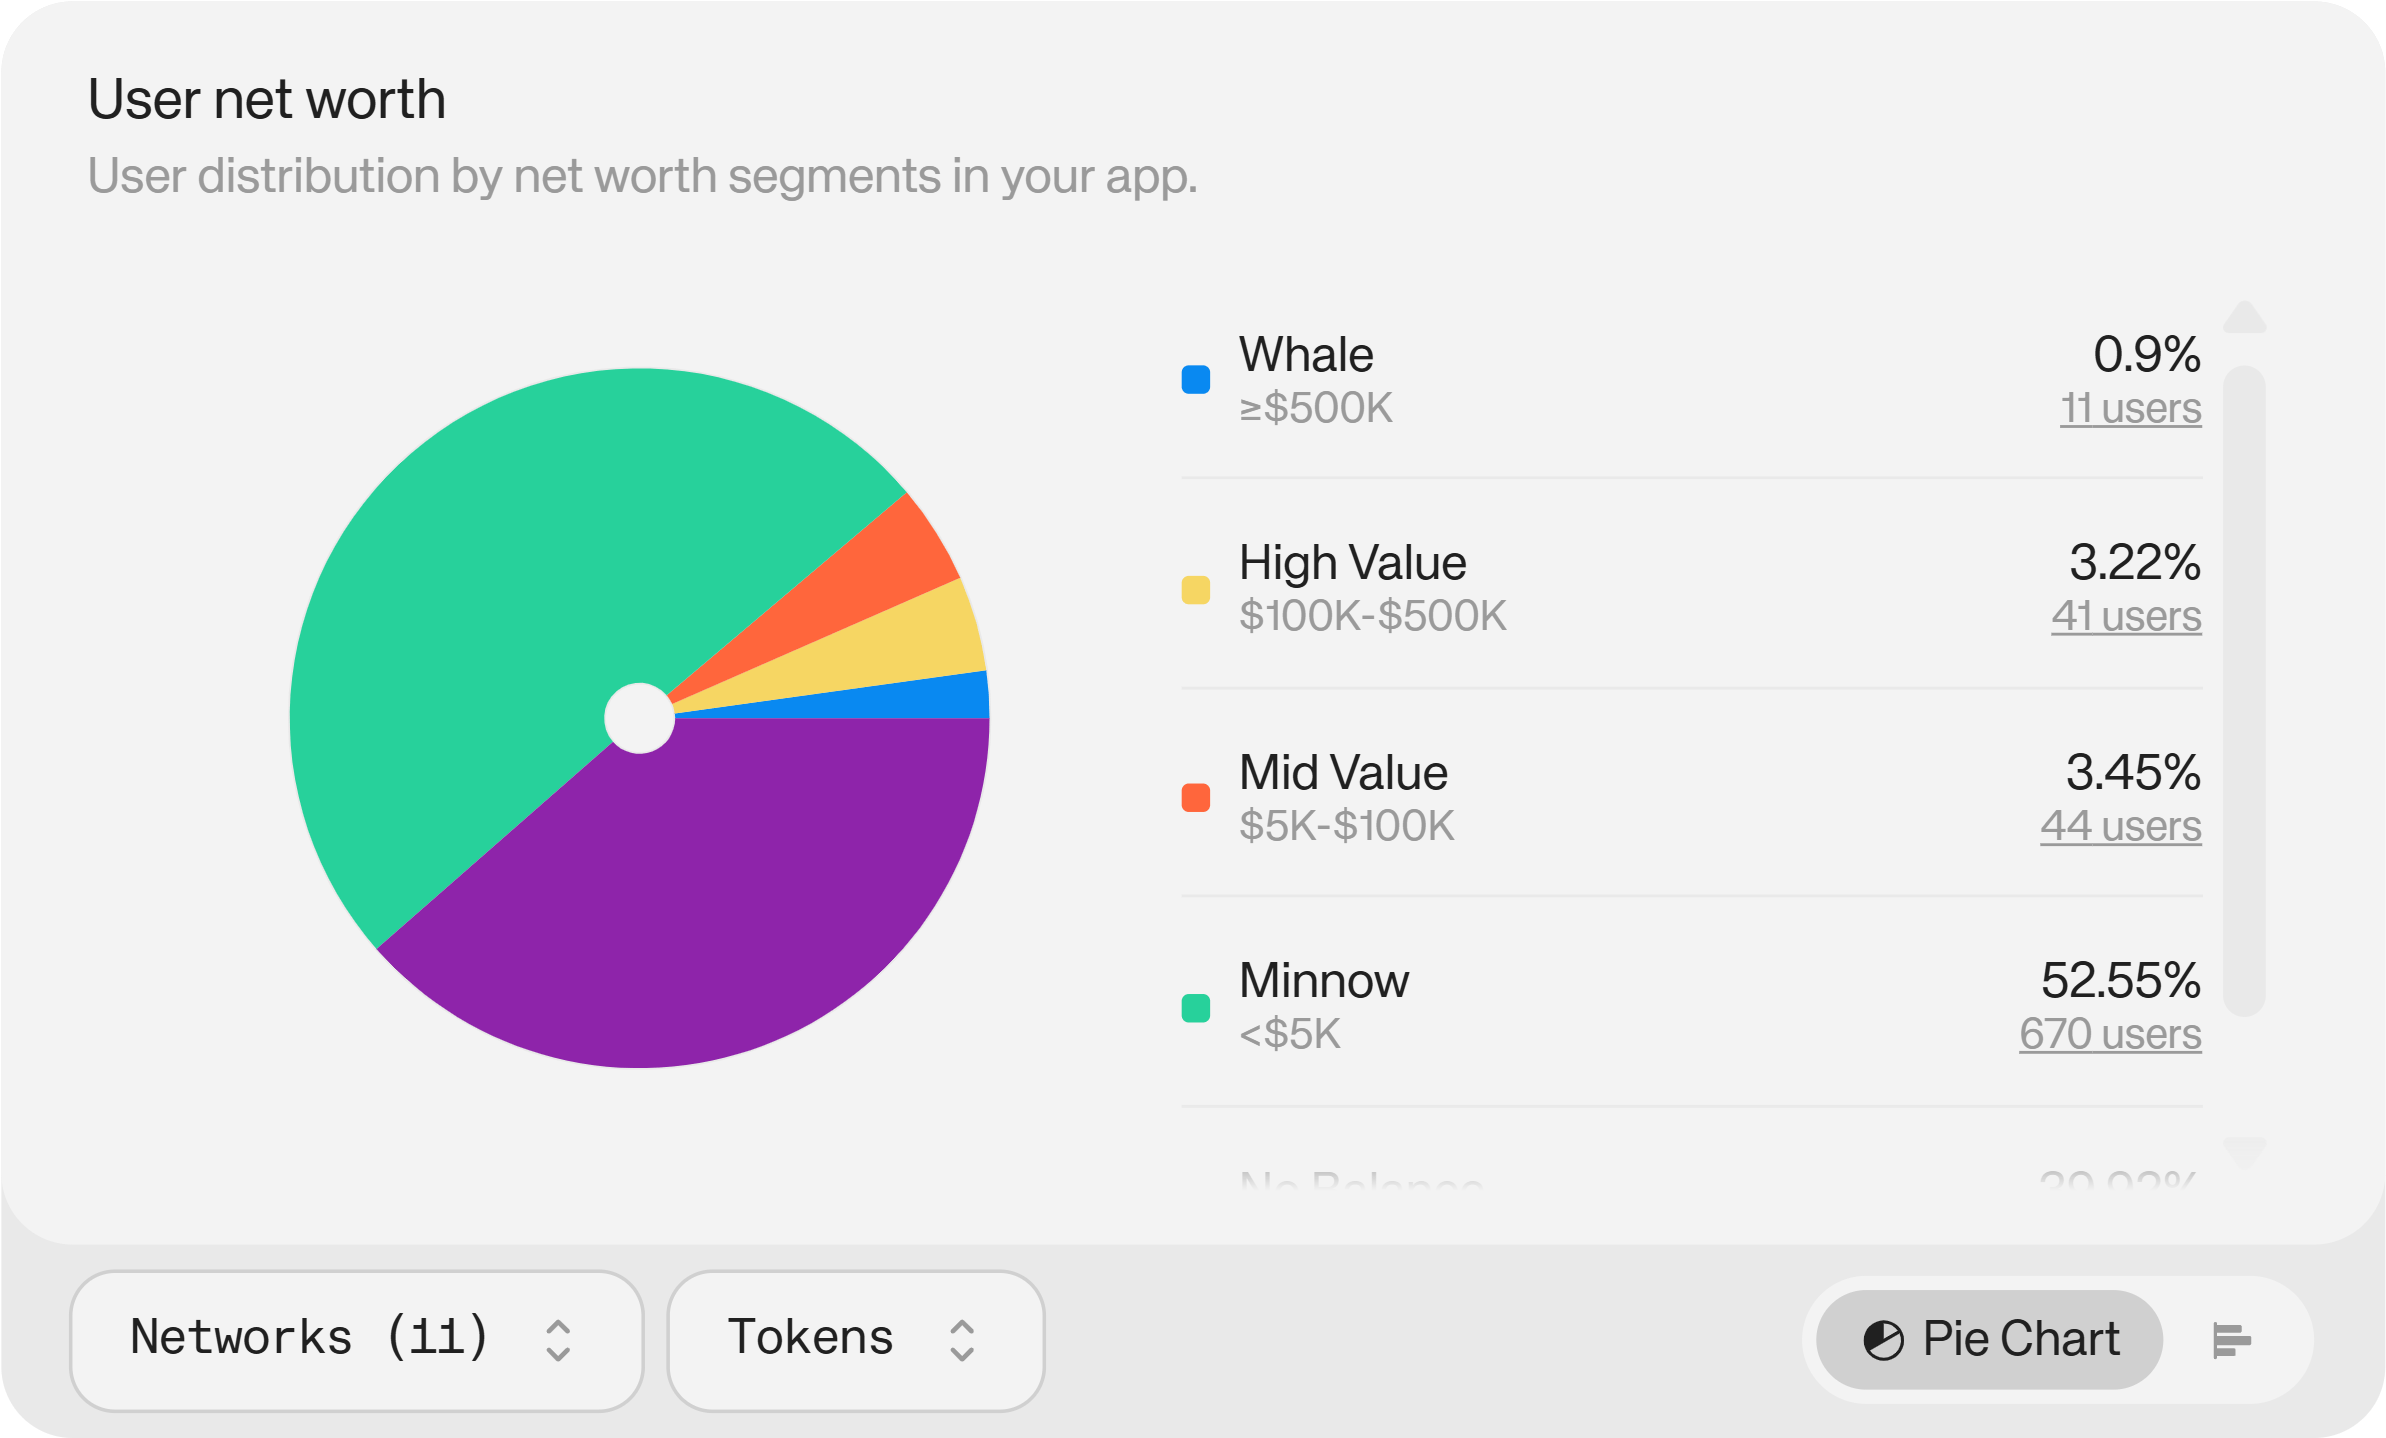
Also under the User Activity tab, the User Net Worth chart categorises your connected users by their total onchain holdings. It surfaces your whales and high-value users at a glance, breaking each segment down by the coins and tokens those users hold. You can see not just who your high-value users are, but what assets they're working with.
Wallet Intelligence Filters
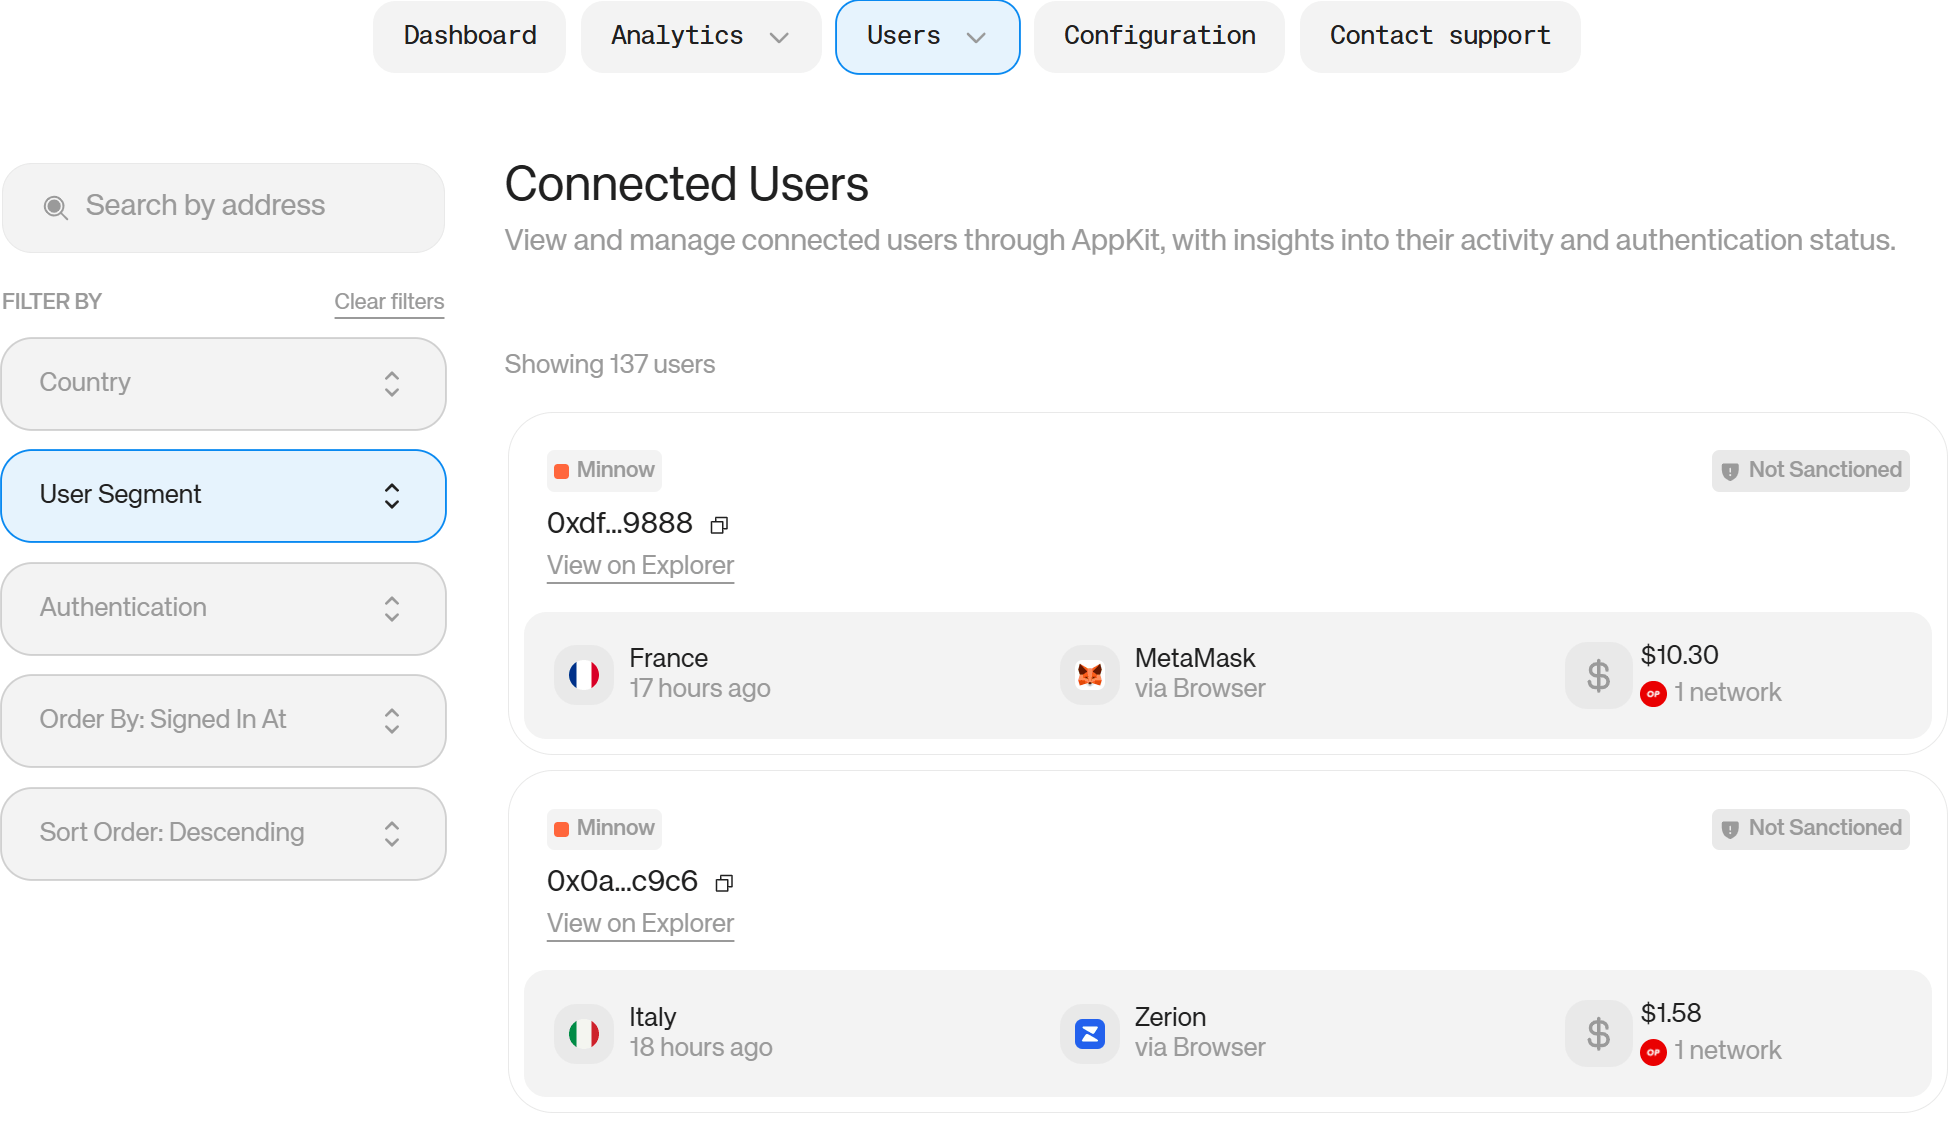
As a new addition to the Users Tab, wallet intelligence lets you discover and research individual users. You can filter your entire connected user base by country, net worth segment, and authentication status — then drill into any individual user's profile to explore their token holdings, the networks they hold tokens on, the wallets they use to connect, and a direct blockchain explorer link for further investigation.
Why it matters
Reown Analytics already gave teams a clear view of how users behaved inside their app. What was missing was context. Now, enterprise teams can dive much deeper into user profiles to understand what kind of users they have and what they’re doing onchain.
For example, the App Co-usage chart lets a web3 social app discover that the majority of their audience are active yield farmers, and start building features that speak to that behaviour rather than guessing. Then, an RWA marketplace might find that their users are deeply engaged with lending protocols, and use that signal to prioritise a lending roadmap.
User net worth segmentation and Wallet Intelligence take this further. A lending protocol that notices a low concentration of high-net-worth users can use this data to inform acquisition and product strategy. An onchain social app that identifies a single whale driving significant revenue can explore that user's onchain profile to understand what attracts users like them — and how to find more.
These are the kinds of decisions that used to require separate analytics tooling, manual data exports, and hours of research. They're now available directly from the Reown dashboard.
How to use the new Enterprise Analytics features
To access the App Co-Usage and User Net Worth Charts:
- Log in to the Reown dashboard
- Navigate to the Analytics tab
- Choose User Activity in the drop down list.
Both charts are available in that dashboard!
For Wallet Intelligence:
- Log in to the Reown dashboard
- Head to the Users tab in the dashboard.
- Filter your connected users by country, net worth segment, or authentication status
- Browse the list of users and/or click into any individual user's profile for their full onchain details.
For more information on each chart and metric, check out the Reown Analytics docs.
And if you're not yet on a paid plan and want to access these new analytics features, chat to our sales team to get your own Enterprise plan.